- Innovations
- Articles on application of PCI
- New Trading Horizons
Currency indices: unveiling central banks’ secrets
Developed countries’ central banks carefully conceal from public their short-term plans. However, investors, organizations and currency traders may and must consider them, making the topic interesting. The current article shows how to create fundamental currency indices, based on Synthetic Instruments created through PQM. Examining the relation between fundamental indices reduces risks, when opening long-term positions with the use of the most liquid currency pairs. The research confirms a theory, implying that during certain global crisis phases, central banks may inevitably switch from cooperation to confrontation.
Currency index as analysis tool
Apart from fundamental factors that affect monetary policy (unemployment, inflation etc.), there are purely quantitive analysis methods to be considered. Hereafter we assume that regulators ensure a sustainable trend, lasting for months or years. Even
if central banks resort rarely to monetary or verbal intervention, they take advantage of these tools to stabilize currencies.
To evaluate a currency in relation to global Forex market it
is required to use currency indices. The apparent benefit of the approach is that it clearly indicates trends within a specific economic zone such as eurozone. Meanwhile, other regions economies have the minimum impact on the currency index. According
to Bank for International Settlements (BIS), in 2013 the following currencies were the most popular, when making international transactions: USD, EUR, JPY, GBP, AUD, CHF, and CAD. To design euro index (EURi) we take a benchmark portfolio, which shows
only slight structural changes, when the EU releases economic statistics. Here is the composition of BEUR benchmark portfolio: BEUR=[USD+JPY+GBP+AUD+CHF+CAD].Thus, the indicator, evaluating the euro in relation to the portfolio, EUR/BEUR, is
based on cross-courses sum. To reduce the benchmark portfolio’s response to eurozone economic news we optimize the currency shares in it. For this purpose we use the specific data on interbank currency turnover, provided by BIS (see the list below).
The shares are determined, based on the residual turnover. This value represents the difference between the overall turnover of the euro in every currency pair and the single pair turnover. A currency weight may be taken in proportion to the residual
share.
- EUR/USD: 6.7%;
- EUR/JPY: 28%;
- EUR/GBP: 28.9%;
- EUR/CHF: 29.5%;
- EUR/AUD: 30.4%;
- EUR/CAD: 30.5%.
Analysts used the described scheme to build EUR and USD indices on the basis of the corresponding portfolios:
BEUR =[USD(4.35%)+JPY(18.2%)+GBP(18.8%)+AUD(19.8%)+CHF(19.2%)+CAD(19.6%)];
BUSD =[EUR(12.7%)+JPY(14.5%)+GBP(17.5%)+AUD(18.1%)+CHF(19.1%)+CAD(18.0%)].
The chart was created in NetTradeX platform, which provides a specific interface to build a personal hybrid instrument (PCI), composed of regular assets (see the figure below). The benchmark portfolio
is shaped by adding currencies into the quoted part. The next step is to distribute capital by changing percentage shares. Let us mark euro index and versus dollar with EURi and vsUSDi symbols respectively. Online quotes and currency
indices composition may be found in the following sections: EURi and vsUSDi. The image below
shows EURi indicator creation process on NetTradeX platform.
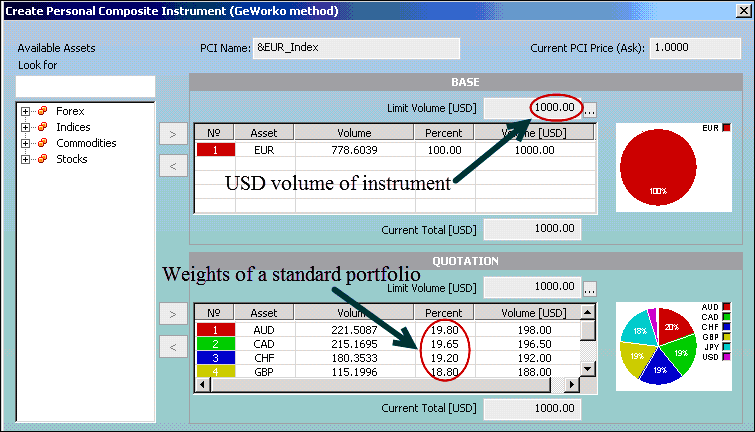
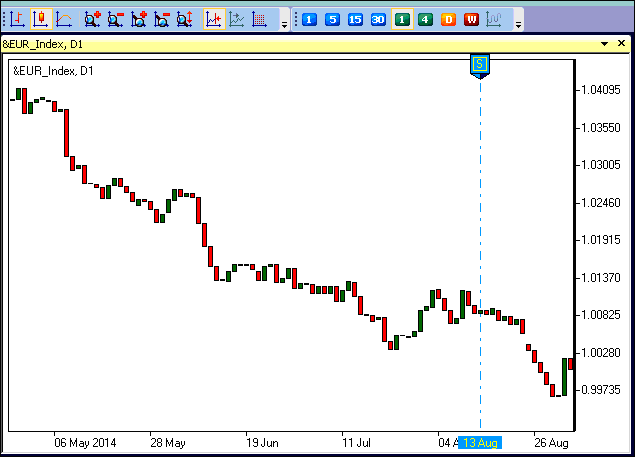
On the figure above, the euro composes the instrument base part (upper table), while the benchmark portfolio forms the quoted part (lower table). You may add the index to the platform’s library after creation. Open and close prices are calculated automatically, based on course correlation between the base and the quoted parts (see the image below).
Crisis aftermath and currency war
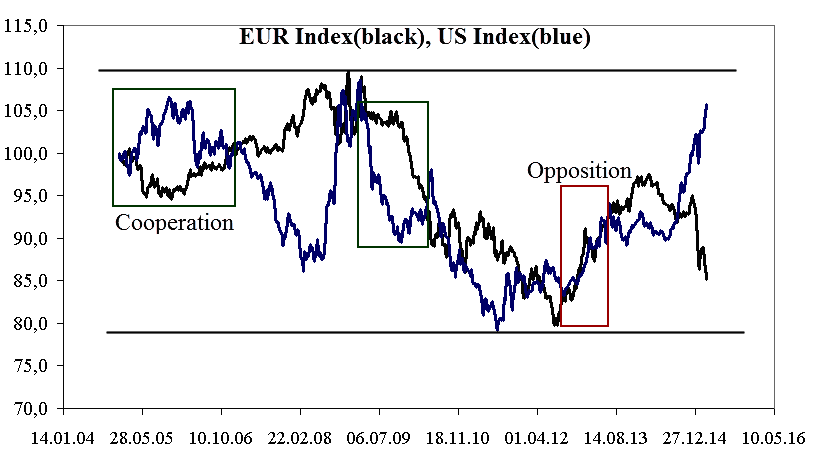
Let us export the charts to Excel and adjust them to a common scale to compare EURi and vsUSDi on the weekly time frame from January to March, 2005. The 100% level is taken as the initial value. The currency indices are traded in a range
from 80-110% with the fluctuations of +/-20% or 70% above the initial value amplitude. In statistic terms, that means that ECB and FRS do not conduct independent monetary policies during the whole period taken. The positive 50% correlation rate in
the course of the historical chart draws our attention to the fact that regulators have more likely been confronting each other (a red rectangle) than cooperating (a green rectangle). The latest red rectangle shows that closer to the chart final segment
(2012-2013) both currencies have been expanding simultaneously. The graph shows euro index (a black line) and dollar index (a blue line) on the weekly time frame.
Adjusted data from 2005 to 2013. Source: IFC Markets, NetTradeX platform:
At this stage, the trade balance in the EU increased from €112.3 to €51.8bln euros, while in the USA it rallied from $460.742 to $400.253bln dollars. The currencies advanced due to post-crisis export stimulus, while indices retreated to the 80% mark. Quantitive easing is a popular strategy, introduced in order to forward capital to industry and services sectors and attract potential government bond buyers. The “long-term money”, brought by QE programs, indicates that long-term investors firmly believe in economic recovery. While market started gradually absorbing bonds, the national debt commenced growing.
ECB reaction
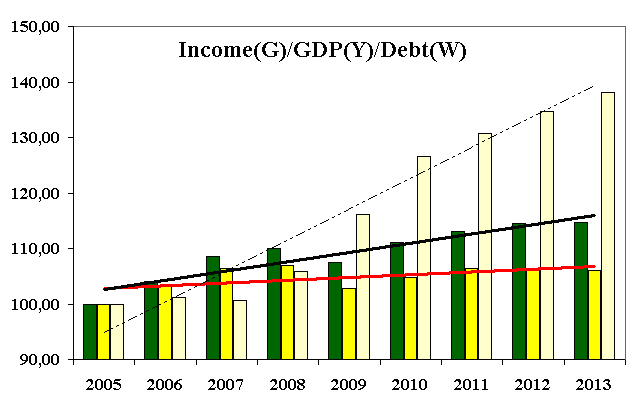
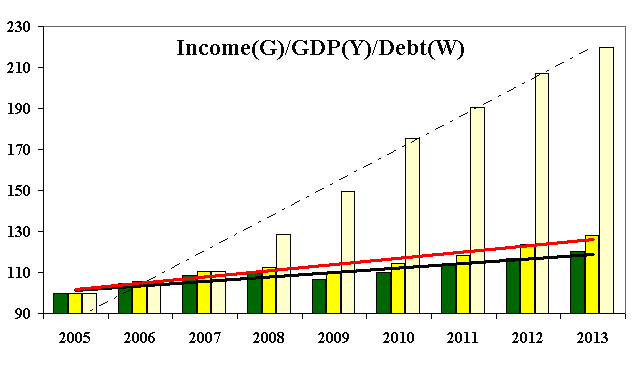
The chart below show income per capita, GDP and national debt in eurozone countries. In 2009, the surge in national debt (dotted line) has overrun the GDP (red line) and income (black line) growth. As soon as QE program was launched, the trade balance
started increasing. The clear goal was to raise household income. However, the gulf between GDP and income was slowly getting bigger just as the distance between GDP and national debt (see the diverging regression lines). The debt was advancing 1.64%
faster than GDP, while personal income was outstripping the GDP growth by 3.4%. It may be concluded that that monetary intervention in eurozone attracted the capital, which more likely added to personal income than boosted GDP.
Basic economic indicators in eurozone. Income per capita (green), GDP (yellow) and national debt (white):
If the eurozone structure remains unchanged and no additional growth stimuli are found, the current economic model will turn into a financial pyramid. Eventually the debt will demand refinancing. A probable reason for slow recovery is the reluctance to conduct retrenchment policy and low taxation efficiency. To be noted, the nonlinear growth period was accompanied by currency retreat, started in 2008 (see the figure below). Initially this pattern allowed attracting long-term capital and stimulating growth, as mentioned above.
FRS reaction
Let us analyze FRS policy in the determined period of currency confrontation (a red rectangle). The pattern has the same quantitive characteristics: Dollar index had been falling since 2009, while exports had been growing. As a result, investment flow
moved GDP from the red zone (minus 2% in 2008) to the green zone (plus 5% in 2013). Financial pyramid features are even more visible here: national debt increases 5.44 times faster than GDP. However, investors’ activity is justified this time: surge
in GDP boosts personal income by means of own economy resources, rather than through redirecting money to pay for social securities. Both regulators take advantage of quantitive easing to attract investment and provide for sustainable economic recovery.
In both cases, such measures form a financial pyramid structure. However, speaking about eurozone, the pyramid is more likely to collapse due to the mentioned fundamental factors. The currency war, which began in 2008, gave more to American economy,
since it converted GDP growth into income.
Basic economic indicators in the USA. Income per capita (green), GDP (yellow) and national debt (white):
Confrontation or cooperation?
ECB and FRS are currently in cooperation phase. Switching from collaboration to confrontation was necessary during global economic crisis and became unprofitable, when such a growth driver as American economy appeared. Being the main US trade partner, the European Union is uninterested in currency war, because it can directly benefit from the recovering US economy. However, the quantitive easing in the EU is already partly exhausted: the liquidity from selling Eurobonds is mostly used for social payments and only then for supporting real sector. We suppose that full-scale QE program will gradually be ended and European economic resources will be aimed to reducing debt. Temporary rate freeze in the USA is a useful measure on the current stage of currency cooperation. If authorities stick to this scenario in the future, the EUR/USD and the related pairs (GBP/USD, USD/CHF) will likely show a trend motion rather than a mean reversion motion. We recommend position traders to consider this, when building personal trading strategies. You may check one of the strategies by watching our webinar - "Forex trading strategy: Cross Market Index. Network approach":
Previous articles
- The Exchange Rate and the Creation of New Financial Instruments on its Base
- Profiting in bear and bull oil markets
- Pair Trading with Inverse Spread: 3 Steps
- Portfolio Trading Method – Expanding the Range of Trading Instruments
- Portfolio Quoting Method – New Ways for Analysis of Financial Markets
- Portfolio Quoting Method - New Trading Strategies