- Innovations
- Articles on application of PCI
- Portfolio Trading
Fourth basic tenet of Dow Theory: serving the investor
The classic analysis of the price chart is the essential part of the intraday trading. Even fundamental investors who examine the timeframes of several months and years use the basic trend analysis for testing their ideas and proper risk hedging. Sluggish stock market features, its partial efficiency was discovered in the 80s of the 20th century. One of the explanations for the market ability to maintain the movement direction when fundamental factors are weakening belongs to George Soros: his theory of reflexivity of stock markets ("The Alchemy of Finance"). The basic idea of it asserts that the behaviour of market participants is affected by expectations of price movements and psychological inertia, which results in the trend retention.
The chart below (see fig.1) shows weekly candlesticks of the German stock index DAX. The index includes share prices of 30 companies involved in different economic sectors in Germany. The equity weighting is defined based on the each company’s capitalization. DAX characterizes the main EU economic growth driver, as the German GDP is of particular importance among the European Union member states as it comprises 20% of the euro zone GDP. The bailout and investment funds granted for other members derived from EU funds mostly depend on the economic situation of the country.
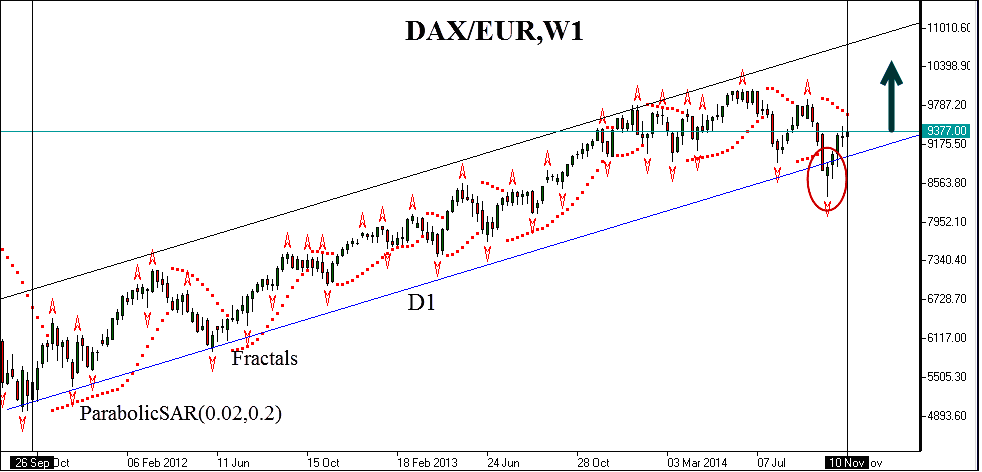
Fig.1. German stock index DAX (GE30). Opening/closing prices.
Betting on stock index is the attractive investment when the EU economy is recovering. For instance, the index buy position on September 26 in 2011 would have brought 30% of annual return by the present day (November, 10 2014) with the maximum drawdown of the position less than 18%. The fund movement is determined by the long-term 4-year trend, which is marked as the uptrend channel on the chart above. The trend line is drawn based on the lower boundary of the candlestick body. How come an investor may hedge risks?
One of the simplest ways is to catch the first signal of trend completion, i.e. the trend line breakout (marked in red ellipse on the chart). For instance, we could have closed the position as soon as the weekly candlestick closed below the uptrend channel boundary. Since all the technical analysis signals gain statistical weight, we admit the breakout to be false. It means that after some time the market price comes back inside the price channel extending fluctuations.
How to reduce the cases of early cancellation order before the trend finishes? We certainly don’t want to pay any additional fee to the broker for the new market entry, especially if the commission is estimated by tens of percents of earnings. In such cases, the common practice is to use additional indicators that would determine whether the signal is correct or not. These filters have a number of input parameters which need to be updated based on the subjective situation assessment, such as overbought/oversold levels of oscillators. As is widely known, the market is not aware of its own parameters and is changed unpredictably. Thus, this approach has several difficulties. The other method implies the ability to attract basic market principles. In the late 1980s Charles Dow developed six tenets of technical analysis. The fourth tenet states that market indices must confirm each other. It means that the Dow Jones Transportation Average (DJTA) cannot be taken into account without the Dow Jones Industrial Average (DJIA). In this case, DJIA is the market macro index. We’ll expand further on this principle for the investment position under consideration.
For the macro index formation we will be using the synthetic euro zone stock index, including the price dynamics of the portfolio composed by three popular stock indices. The index is based on the PCI model and GeWorko method. The basic part of the instrument contains three CFDs on DE 30 index (the one similar to DAX), 6 CFDs on FR 40 index (similar to CAC 40) and 3 CFDs on GB 100 index (similar to FTSE 100). The portfolio is priced in euro. The indices are represented as continuous CFDs on corresponding futures. The chart of opening and closing weekly prices made up in NetTradeX is given below. The instrument chart is available online, or it can be downloaded on the website and implemented in the trading terminal. We can observe that the euro zone stock index is in agreement with the German DAX over the time period under consideration, except for the false breakout of the 6th of October. The fourth tenet of Dow Theory is used as the trend signal filter. In this case, the position is closed only if &Indices_EU macro index candlestick is closed below the trend line (see Fig.2). It happened neither in this case, nor in many others. It means the position remains in the market. We were right because DAX is going back into the trend channel and continues the victorious movement in the green zone direction, accumulating the investor’s returns. The advantage of such a method is the ability to use more capital-intensive stock index (&Indices_EU) as exclusively analytical instrument. Commission is not charged for the market entry, but the basic strategy of investing in DAX is improved.
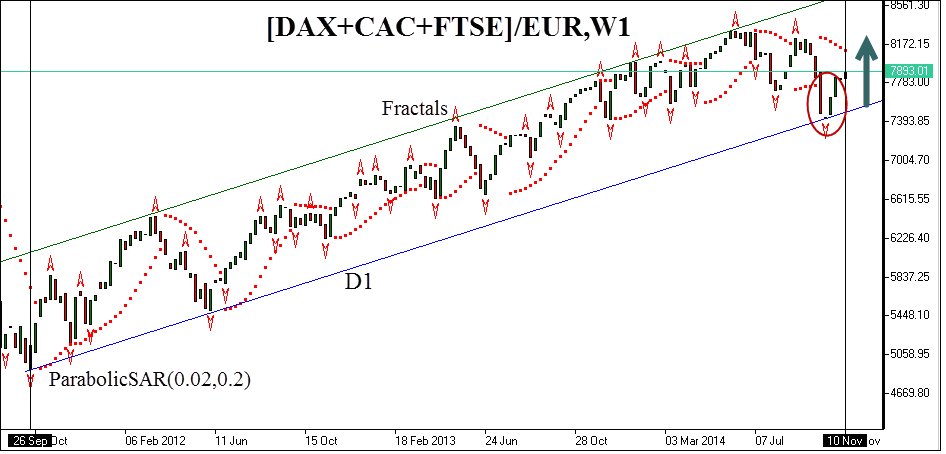
Fig.2. Composite stock index &Indices_EU. Opening/closing prices.
Let’s consider another case study: trading within the limits of the price channel, which is used as an option to the trend-following strategy. Support and resistance levels are based on Bill Williams fractals (see fig.3). The price channel is divided into three zones: BUY, SELL or "stay out of the market" zone. When crossing the border of the lower BUY zone downwards, buy order is triggered and Stop loss is placed at 9081.50.
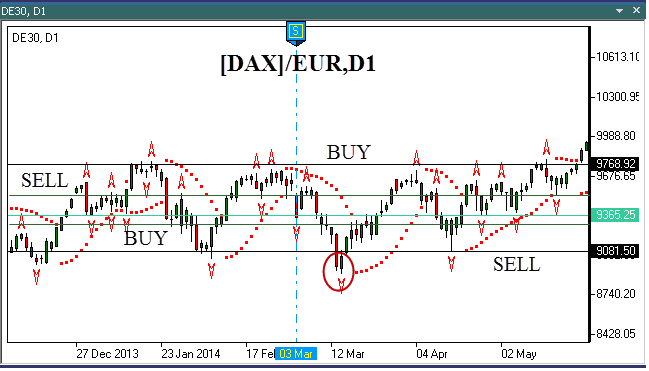
Fig.3. The German index DAX (GE30). Sideways trading.
The position is closed as soon as the price enters SELL zone, i.e. crosses the zone’s lower boundary. It is accompanied by short selling and etc. The potential profit is approximately twice higher than the risks involved. It is provided by the 3-zone channel division. Despite the ease in method applying, the strategy allows placing tight Stop loss orders, therefore risks are efficiently reduced. But even that won’t save us from false breakouts, one of which is marked in red ellipse on the figure 3. Once again assistance comes from the fourth tenet of Dow Theory. As the corresponding low of the macro index didn’t break the support level (see Fig.4), the position is held with Stop loss moving down to the next level. Levels can be built using the Fibonacci grid. Another option is to use a "locking" method, when an opposite buy position is opened when the bearish breakout is not confirmed. Unlocking takes place once the price comes back to the lower part of the channel. As seen on the chart, the price is really going back into the channel boundaries and advances further on. Again, profits are growing. Some prefer strategies based on sideways channel breakout. In this case, the index purchasing is performed as soon as the upper channel boundary is breached at 9768.92. Once again, the filter based on synthetic stock index helps to separate the truth from lies. The breakout is confirmed by the systematic index, and it means the position may be opened. The price makes a farewell reversal and goes up. We hit the target over again!
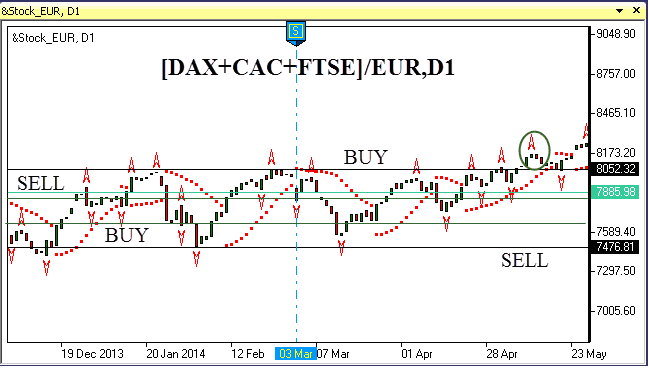
Fig.4. Composite stock index &Indices_EU. Channel breakout.
Of course, this strategy doesn’t allow you to reduce risks to zero, but there is an additional mechanism which will help to reduce the amount of unprofitable positions and improve the annual results. Main benefits of this method are simplicity, accessibility and market fundamentals enclosed in it. The index is of the highest priority, i.e. the European stock macro index is less susceptible to random deviations as it has higher capital diversification. Its sluggish movement is determined by system factors, not exposed to "noise". The main index movement triggers capital reallocation, and even outsiders join the mainstream. In the given example it is caused by close trade ties and common economic space of the EU: growth drivers increase the trade turnover and attract investment (not only direct) in the region, some of which stimulates the growth of lagging companies. In the example considered above we can see that the &Indices_EU index update moves DAX, and once again we also move with the market. You can test this method when investing in other classic American and Asian indices, and make sure “classics” keeps working out. At the same time you will get a better understanding of market mechanisms and the globalization of capital markets, which will definitely help you to be a more successful investor.
Dear traders. We also suggest that you become familiar with methods of hedging portfolio risks based on PCI model:Previous articles
- Portfolio spread based on continuous futures
- Sharpe Portfolio | "The Three Leaders" - DJIA, S&P500, Nasdaq 100
- Portfolio Quoting Method for Analysis of "Good" and "Bad" Portfolios
- Portfolio Optimization through PQM Method (Part 2)
- Portfolio Optimization through PQM Method (Part 1)
- Stock Portfolio Construction | Stock Portfolio Analysis - Pportfolio Quoting Method PQM