- Analytics
- Technical Analysis
Brent Crude Oil Technical Analysis - Brent Crude Oil Trading: 2016-09-19
Rising supply a headwind for Brent crude price
Brent crude price has been declining on continued excess of supply over global demand. Will the price resume advancing?
Brent crude oil price has been rebounding after hitting multi-year low in January. It has gained more than 68% since. However the rebalancing of global oil market has not proceeded at a pace initially hoped for as global supply still outstrips demand. Last week reports from the Organization of the Petroleum Exporting Countries, the Paris-based International Energy Agency and the US Energy Information confirmed the continuing oversupply of crude. The news last week that Nigeria and Libya are planning to increase oil exports was additional bearish factor for oil prices. Royal Dutch Shell and Exxon Mobil announced they have resumed Nigerian exports after militants had caused the shut-in of supply. Libya is also planning to resume exports from its Ras Lanuf port. The increased exports could result in additional supply of 1 million barrel per day, pressuring oil prices.
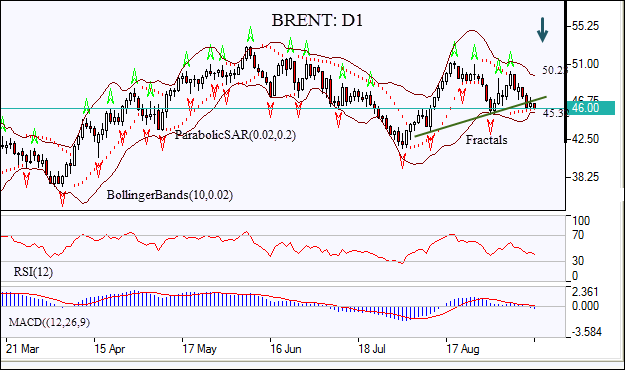
On the daily chart the BRENT: D1 has been retracing after rebounding to one-and-half month high in mid-August.
- The price has fallen below the neckline of a head-and-shoulders pattern, which is a bearish signal.
- The Parabolic indicator gives a buy signal.
- The Bollinger bands have narrowed, indicating decreasing volatility.
- The RSI oscillator is falling but hasn’t reached the oversold zone yet.
- The MACD indicator is below the signal line and the gap is rising which is also a bearish signal.
We expect the bearish momentum will continue after the price breaches below last fractal low at 45.32. This level can be used as an entry point for a pending order to sell. The stop loss can be placed above the last fractal high at 50.23. After placing the pending order, the stop loss is to be moved to the next fractal low, following Parabolic signals. By doing so, we are changing the probable profit/loss ratio to the breakeven point. The most risk-averse traders may switch to the 4-hour chart after the trade and place there a stop-loss moving it in the direction of the trade. If the price meets the stop loss level (50.23) without reaching the order (45.23), we recommend canceling the position: the market sustains internal changes which were not taken into account.
Technical Analysis Summary
| Position | Sell |
| Sell stop | Below 45.23 |
| Stop loss | Above 50.23 |
Explore our
Trading Conditions
- Spreads from 0.0 pip
- 30,000+ Trading Instruments
- Stop Out Level - Only 10%
Ready to Trade?
Open Account Note:
This overview has an informative and tutorial character and is published for free. All the data, included in the overview, are received from public sources, recognized as more or less reliable. Moreover, there is no guarantee that the indicated information is full and precise. Overviews are not updated. The whole information in each overview, including opinion, indicators, charts and anything else, is provided only for familiarization purposes and is not financial advice or а recommendation. The whole text and its any part, as well as the charts cannot be considered as an offer to make a deal with any asset. IFC Markets and its employees under any circumstances are not liable for any action taken by someone else during or after reading the overview.
