- Analytics
- Technical Analysis
CAD Currency Index Technical Analysis - CAD Currency Index Trading: 2017-08-02
Preparing for the publication of significant statistics
In this review, we suggest considering the personal composite instrument (PCI) "CAD vs. Currencies". It reflects the price dynamics of the Canadian dollar against other world currencies. Is there a possibility for the CAD_Index price to decline?
The PCI decreases in case of the weakening of the Canadian dollar against other major world currencies. On Friday, the data on foreign trade for June and the labor market for July will come out in Canada. The negative foreign trade balance is expected to be maintained and the number of new jobs- reduced. Theoretically, negative data may contribute to the weakening of the Canadian dollar. Earlier, the Canadian dollar rose against the US dollar by 10% since early May, 2017 and by 4% in July. The main reason for this was investors’ expectations that the Bank of Canada will raise the interest rate for the first time in 7 years at its meeting on October 25, 2017. At the same time, the probability for this to happen already at the next meeting on September 6, is estimated quite low - at the level of 40%. It is possible that in this period there may be a correction of the Canadian dollar.
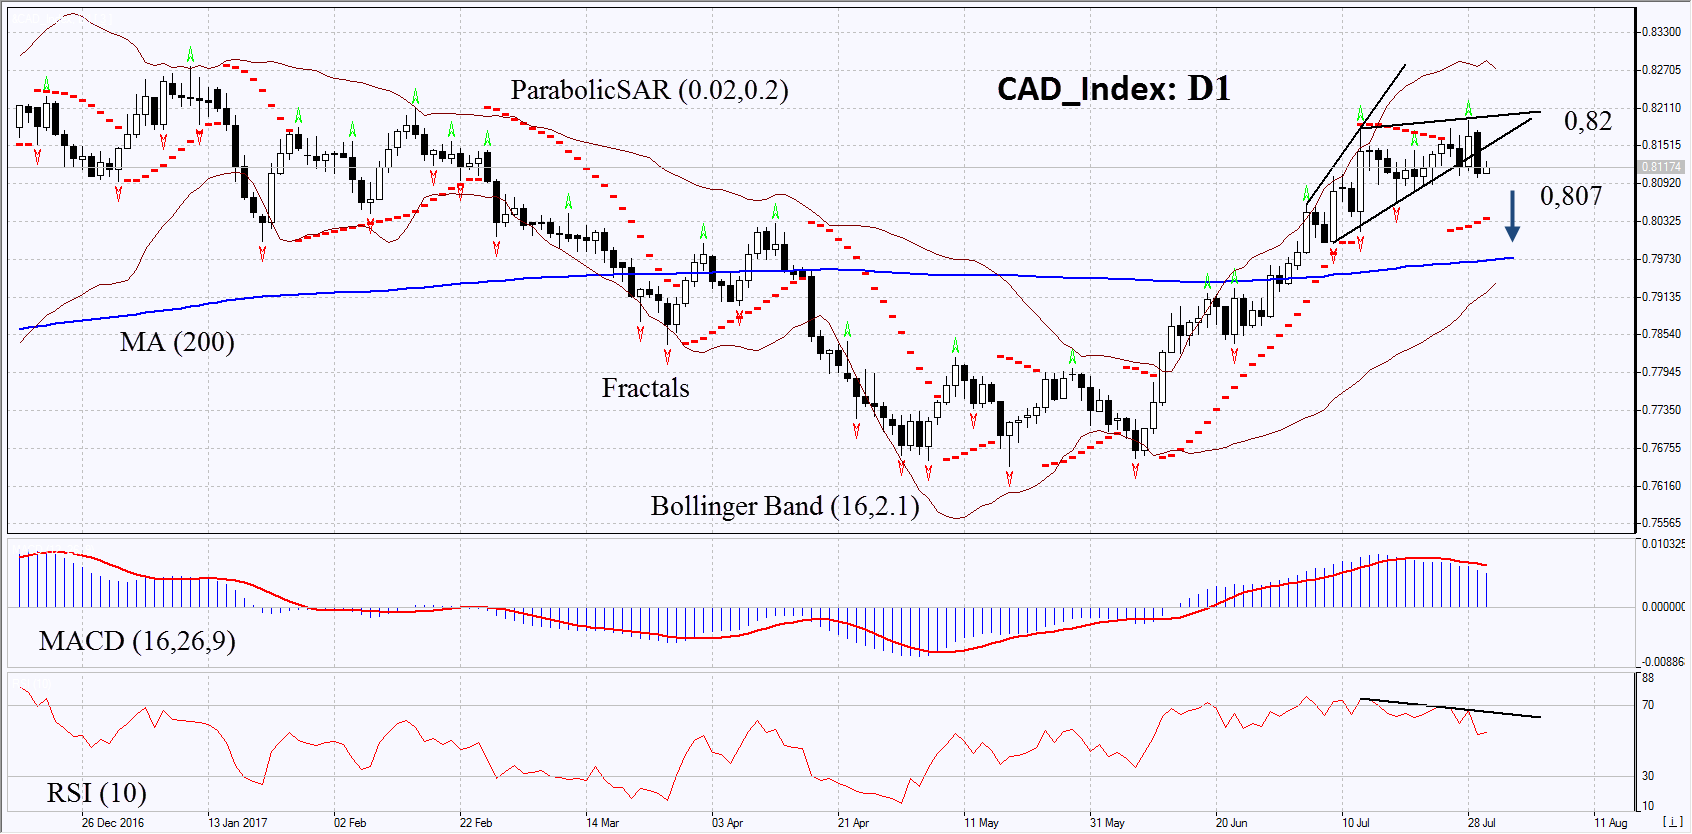
On the daily timeframe, CAD_Index: D1 has come out of the uptrend. The continuation of the downward correction is possible in case of the publication of weak economic data in Canada.
- The Parabolic indicator gives a bullish signal.
- The Bollinger bands have widened, which means higher volatility.
- The RSI indicator is above 50. It has formed a weak negative divergence.
- The MACD indicator gives a bearish signal.
The bullish momentum may develop in case CAD_Index drops below 0.807. This level may serve as an entry point. The initial stop loss may be placed above the last fractal high at 0.82. After opening the pending order, we shall move the stop to the next fractal high following the Bollinger and Parabolic signals. Thus, we are changing the potential profit/loss to the breakeven point. More risk-averse traders may switch to the 4-hour chart after the trade and place there a stop loss moving it in the direction of the trade. If the price meets the stop level at 0.82 without reaching the order at 0.807 we recommend cancelling the position: the market sustains internal changes that were not taken into account.
Summary of technical analysis
| Position | Sell |
| Sell stop | below 0,807 |
| Stop loss | above 0,82 |
Explore our
Trading Conditions
- Spreads from 0.0 pip
- 30,000+ Trading Instruments
- Stop Out Level - Only 10%
Ready to Trade?
Open Account Note:
This overview has an informative and tutorial character and is published for free. All the data, included in the overview, are received from public sources, recognized as more or less reliable. Moreover, there is no guarantee that the indicated information is full and precise. Overviews are not updated. The whole information in each overview, including opinion, indicators, charts and anything else, is provided only for familiarization purposes and is not financial advice or а recommendation. The whole text and its any part, as well as the charts cannot be considered as an offer to make a deal with any asset. IFC Markets and its employees under any circumstances are not liable for any action taken by someone else during or after reading the overview.
