- Analytics
- Technical Analysis
CORN Technical Analysis - CORN Trading: 2018-03-30
Lower US sowings bullish for corn prices
US farmers intend to cut corn sowings this year. Will corn prices continue the rebound?
Corn prices rose sharply on Thursday after the US Department of Agriculture's weekly export sales, sowings and stocks reports. The sowings report indicated US farmers plan to reduce corn sowings by 2.14m acres to 88.03m acres, below an expected 89.42m acres. Farmers cited intentions to switch to cotton and wheat, which command relatively higher prices, as the primary reason. Lower corn supply expected from smaller sowing area is bullish for corn prices. A bearish risk for corn is possible further weakening of demand for the crop as USDA stocks data implied corn consumption in the previous three months at 3.68bn bushels, compared with 3.76bn bushels during the same period last year.
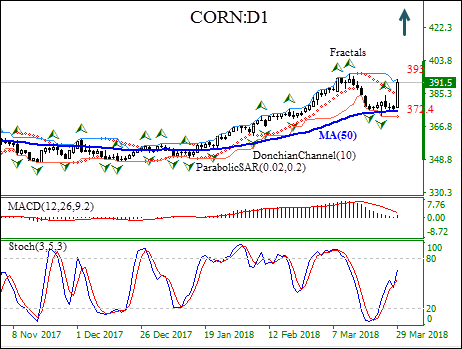
On the daily timeframe CORN: D1 had been retracing after hitting eight-month high in mid-March. The price is above the 50-day moving average MA(50).
- The Donchian channel is tilted up indicating uptrend.
- The Parabolic indicator has formed a buy signal.
- The MACD indicator is above the signal line and the gap is widening, which is bullish.
- The stochastic oscillator is rising but has not reached the overbought zone.
We believe the bullish momentum will continue after the price closes above the upper boundary of Donchian channel at 393. This level can be used as an entry point for placing a pending order to buy. The stop loss can be placed below last fractal low at 372.4. After placing the order, the stop loss is to be moved every day to the next fractal low, following Parabolic signals. Thus, we are changing the probable profit/loss ratio to the breakeven point. If the price meets the stop loss level (372.4) without reaching the order (393), we recommend cancelling the order: the market has undergone internal changes which were not taken into account.
Technical Analysis Summary
| Position | Buy |
| Buy stop | Above 393 |
| Stop loss | Below 372.4 |
Explore our
Trading Conditions
- Spreads from 0.0 pip
- 30,000+ Trading Instruments
- Stop Out Level - Only 10%
Ready to Trade?
Open Account Note:
This overview has an informative and tutorial character and is published for free. All the data, included in the overview, are received from public sources, recognized as more or less reliable. Moreover, there is no guarantee that the indicated information is full and precise. Overviews are not updated. The whole information in each overview, including opinion, indicators, charts and anything else, is provided only for familiarization purposes and is not financial advice or а recommendation. The whole text and its any part, as well as the charts cannot be considered as an offer to make a deal with any asset. IFC Markets and its employees under any circumstances are not liable for any action taken by someone else during or after reading the overview.
