- Analytics
- Technical Analysis
EUR/CHF Technical Analysis - EUR/CHF Trading: 2018-05-09
Italy is unable to form a government for already two months
In this review, we suggest considering the euro vs the Swiss franc currency pair. Its decline on the chart means the weakening of the euro and strengthening of the franc. Will EURCHF prices fall?
Positive economic data were published in Switzerland. The inflation and unemployment rate for April were better than preliminary forecasts. In April, foreign-exchange reserves rose by 2.5% compared to March and reached $ 756.4 billion. The next significant statistics will be released only at the end of May. Theoretically, good economic indicators may contribute to a rate hike by the National Bank of Switzerland (NBS). Now, it is minus 0.75%. The rate of the European Central Bank is zero. Due to this difference, in the past 12 months, the Swiss franc has fallen against the euro by 13.2%. On the chart, this trend looks like an increase. In case of any real evidence of a possible rate hike by the NBS, a downward correction is not excluded. Its next meeting will be held on June 21, 2018. In turn, the ECB is not going to raise its rate yet. An additional negative for the euro was the government crisis in Italy and the risks of strengthening the positions of Eurosceptics. On March 4, 2018, parliamentary elections were held in Italy, but the coalition government has not been formed yet. If this does not happen in the near future, new elections in the Italian parliament may be held. Data on the Eurozone GDP for the 1st quarter of the current year, which may affect the dynamics of the euro, will be released on May 15.
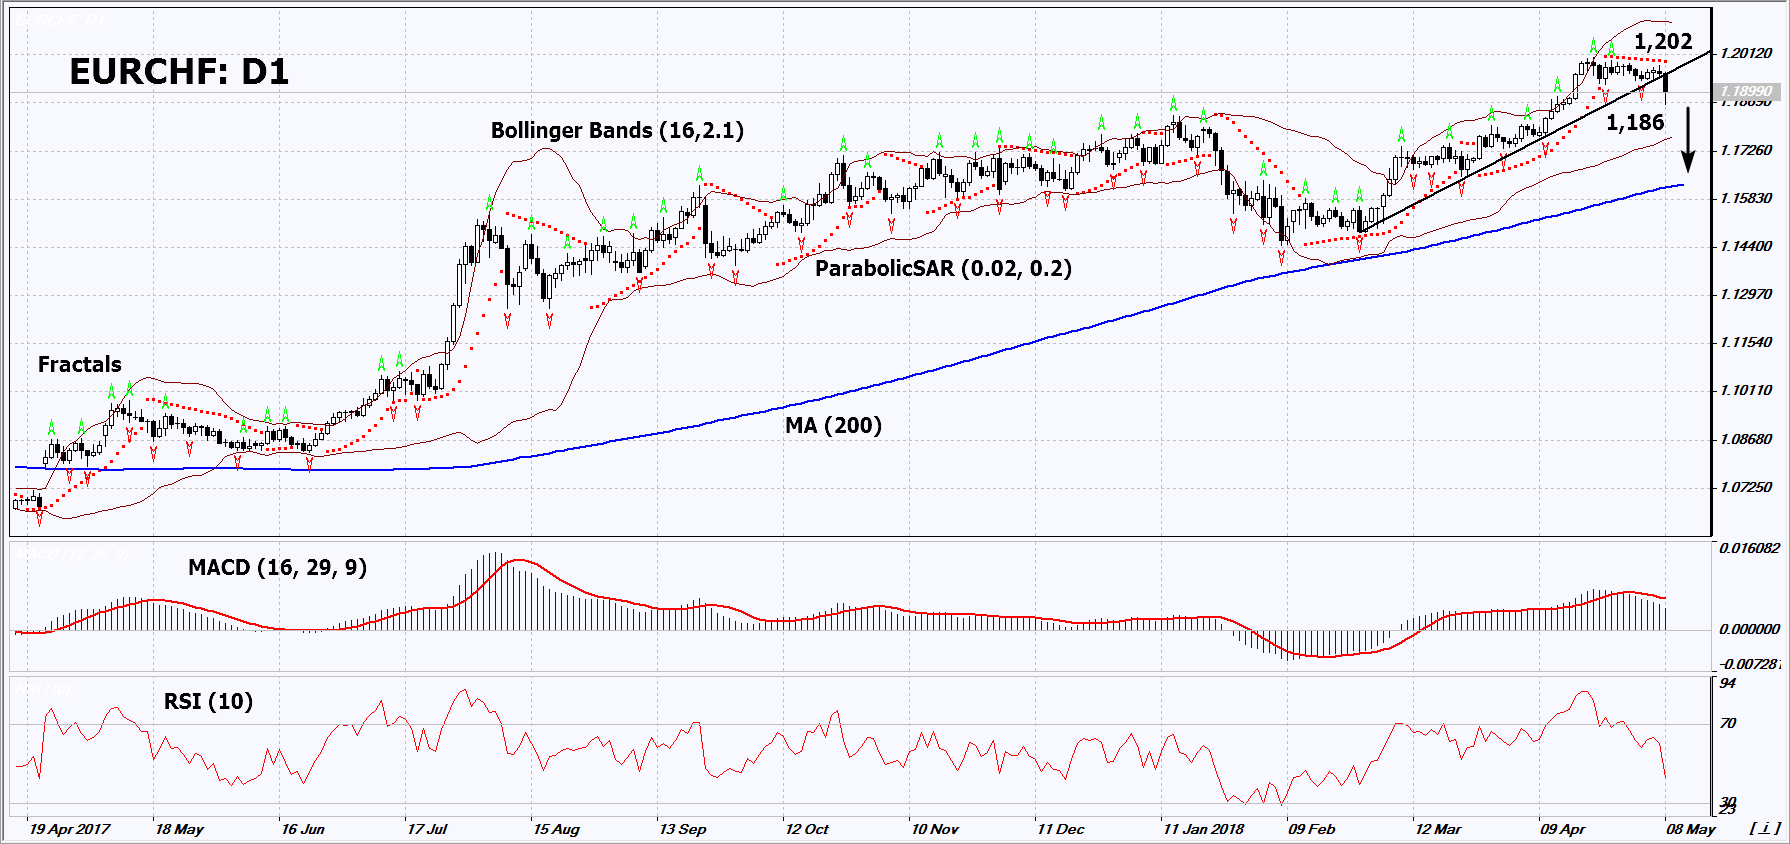
On the daily timeframe, EURCHF: D1 breached down the support line of the uptrend. Investors' expectations of a rate hike by the Swiss Central Bank and political risks in Italy may contribute to the price decrease of the currency pair.
- The Parabolic indicator gives a bearish signal.
- The Bollinger bands have widened, which indicates high volatility.
- The RSI indicator is below 50. No divergence.
- The MACD indicator gives bearish signals.
The bearish momentum may develop in case EURCHF falls below its last low at 1.186. This level may serve as an entry point. The initial stop loss may be placed above the two last fractal highs, the 3-year high and the Parabolic signal at 1.2. After opening the pending order, we shall move the stop to the next fractal high following the Bollinger and Parabolic signals. Thus, we are changing the potential profit/loss to the breakeven point. More risk-averse traders may switch to the 4-hour chart after the trade and place there a stop loss moving it in the direction of the trade. If the price meets the stop level at 1.202 without reaching the order at 1.186, we recommend to close the position: the market sustains internal changes that were not taken into account.
Summary of technical analysis
| Position | Sell |
| Sell stop | Below 1,186 |
| Stop loss | Above 1,202 |
Explore our
Trading Conditions
- Spreads from 0.0 pip
- 30,000+ Trading Instruments
- Stop Out Level - Only 10%
Ready to Trade?
Open Account Note:
This overview has an informative and tutorial character and is published for free. All the data, included in the overview, are received from public sources, recognized as more or less reliable. Moreover, there is no guarantee that the indicated information is full and precise. Overviews are not updated. The whole information in each overview, including opinion, indicators, charts and anything else, is provided only for familiarization purposes and is not financial advice or а recommendation. The whole text and its any part, as well as the charts cannot be considered as an offer to make a deal with any asset. IFC Markets and its employees under any circumstances are not liable for any action taken by someone else during or after reading the overview.
