- Analytics
- Technical Analysis
EUR/USD Technical Analysis - EUR/USD Trading: 2017-03-03
Expected Fed tightening is bearish for euro
Higher likelihood of a Fed rate hike in March is bearish for euro. Will the euro continue the slide against the greenback?
Raised expectations of a 0.25 percentage point rate hike at mid-March Federal Reserve meeting together with positive US economic data recently have contributed to added dollar strength against major currencies. And Trump’s promise of “massive” tax cuts for middle class Americans and the pledge to push for $1 trillion dollar infrastructure spending programs also bolstered US economic growth outlook, boosting dollar further. In comparison, euro-zone economies also are on track for continued recovery, activities in the euro-zone’s manufacturing sector expanded in February, though at a slower rate than previously estimated: Manufacturing PMI in euro-zone rose to 55.4 compared with a preliminary estimate of 55.5, Markit reported Wednesday. And German inflation hit 2.2% in February, the highest in more than 4 years. At the same time heightened political uncertainty weighs on euro with results of French presidential elections potentially capable of producing a surprise win for Marine Le Penne, the leader of the French National Front, who has vowed to hold a referendum on leaving the European Union and euro-zone within months of her election. Next major economic data are due on March 7 when EU’s statistics agency Eurostat reports third reading of fourth quarter euro-zone GDP , and the German statistics department Destatis reports January factory orders. Positive surprises will be bullish for euro.
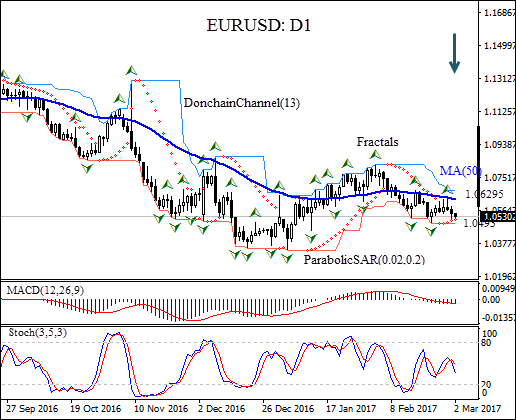
On the daily timeframe EUR/USD has been trading with a negative bias after hitting a 2-month high in end of January. The price is falling after reflecting off the 50-day moving average MA(50).
- The Donchian channel is flat, indicating no trend yet.
- The MACD indicator gives a bearish signal.
- The Parabolic indicator gives a buy signal.
- The stochastic oscillator is falling toward the oversold zone but has not reached it yet.
We believe the bearish momentum will continue after the price closes below the lower Donchian boundary at 1.0493, confirmed also by last fractal low. It can be used as an entry point for a pending order to sell. The stop loss can be placed above the last fractal high at 1.06295. After placing the pending order the stop loss is to be moved every day to the next fractal high, following Parabolic signals. Thus, we are changing the probable profit/loss ratio to the breakeven point. If the price meets the stop-loss level (1.06295) without reaching the order (1.0493) we recommend cancelling the position: the market sustains internal changes which were not taken into account.
Technical Analysis Summary
| Position | Sell |
| Sell stop | Below 1.0493 |
| Stop loss | Above 1.06295 |
Explore our
Trading Conditions
- Spreads from 0.0 pip
- 30,000+ Trading Instruments
- Stop Out Level - Only 10%
Ready to Trade?
Open Account Note:
This overview has an informative and tutorial character and is published for free. All the data, included in the overview, are received from public sources, recognized as more or less reliable. Moreover, there is no guarantee that the indicated information is full and precise. Overviews are not updated. The whole information in each overview, including opinion, indicators, charts and anything else, is provided only for familiarization purposes and is not financial advice or а recommendation. The whole text and its any part, as well as the charts cannot be considered as an offer to make a deal with any asset. IFC Markets and its employees under any circumstances are not liable for any action taken by someone else during or after reading the overview.
