- Analytics
- Technical Analysis
FR 40 Technical Analysis - FR 40 Trading: 2018-12-28
Weaker French data bearish for FR40
Third quarter French economic growth was revised lower. Will the FR 40 continue declining?
Recent French economic data were negative: French Q3 GDP growth was revised lower. French economy expanded 1.4% year-over-year in the third quarter, down from an upwardly revised 1.7% growth in the previous three-month period. The economic growth rate over previous quarter was revised lower to 0.3% in the three months to September 2018, compared to a near one-year high of 0.4% initial estimate. And while household consumption grew by 0.4% and fixed investment by businesses also grew faster there are significant downside external and internal risks for fourth quarter GDP. Internally, the ‘yellow vest’ protests in response to a proposed fuel-tax hike will have a negative effect on output, and externally protracted US-China trade dispute and uncertainty surrounding its outcome is hurting global growth prospects. Weak economic data are bearish for French stock index FR 40.
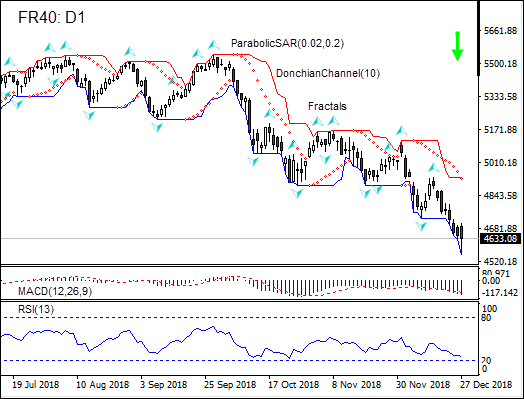
On the daily timeframe the FR40: D1 is declining after retracing to 6-month high in the end of September.
- The Parabolic indicator gives a sell signal.
- The Donchian channel indicates downtrend: it is tilted lower.
- The MACD indicator gives a bearish signal: it is below the signal line and the gap is widening.
- The Stochastic oscillator has breached into the oversold zone, this is bullish.
We believe the bearish momentum will continue after the price closes below the lower boundary of Donchian channel at 4553.58. This level can be used as an entry point for placing a pending order to sell. The stop loss can be placed above the last fractal high at 4935.02. After placing the order, the stop loss is to be moved every day to the next fractal high, following Parabolic signals. Thus, we are changing the expected profit/loss ratio to the breakeven point. If the price meets the stop loss level (4935.02) without reaching the order (4553.58), we recommend cancelling the order: the market has undergone internal changes which were not taken into account.
Technical Analysis Summary
| Position | Sell |
| Sell stop | Below 4553.58 |
| Stop loss | Above 4935.02 |
Explore our
Trading Conditions
- Spreads from 0.0 pip
- 30,000+ Trading Instruments
- Stop Out Level - Only 10%
Ready to Trade?
Open Account Note:
This overview has an informative and tutorial character and is published for free. All the data, included in the overview, are received from public sources, recognized as more or less reliable. Moreover, there is no guarantee that the indicated information is full and precise. Overviews are not updated. The whole information in each overview, including opinion, indicators, charts and anything else, is provided only for familiarization purposes and is not financial advice or а recommendation. The whole text and its any part, as well as the charts cannot be considered as an offer to make a deal with any asset. IFC Markets and its employees under any circumstances are not liable for any action taken by someone else during or after reading the overview.
