- Analytics
- Technical Analysis
GBP/USD Technical Analysis - GBP/USD Trading: 2019-04-08
Brexit talks are deadlocked
British Prime Minister Theresa May asked the European Union to delay Brexit until June 30, 2019. Will the GBPUSD fall? Such dynamics indicate the weakening of the British pound.
In accordance with the referendum held on June 23, 2016, the United Kingdom had to leave the European Union on March 29, 2019. However, after British Prime Minister Theresa May’s numerous requests, the European Union postponed Brexit until April 12 at the meeting held on March 21, 2019. Prior to this, the British Parliament has rejected the agreement on leaving the EU three times. Meanwhile, Brexit, without an approved mutual agreement, may cause the UK significant losses and have a negative impact on the exchange rate of the pound. The elections to the European Parliament will take place on May 23-26, and the EU leaders are not interested in the participation of the UK at all, which will soon leave the European Union one way or another. The chances of resolving Brexit problems before these elections are not too high. In turn, the date of June 30 will not allow to hold a new referendum in the UK, as there will be little time for its preparation. This week, data on industrial production and foreign trade in February, which may affect the pound exchange rate, will be published in the UK.
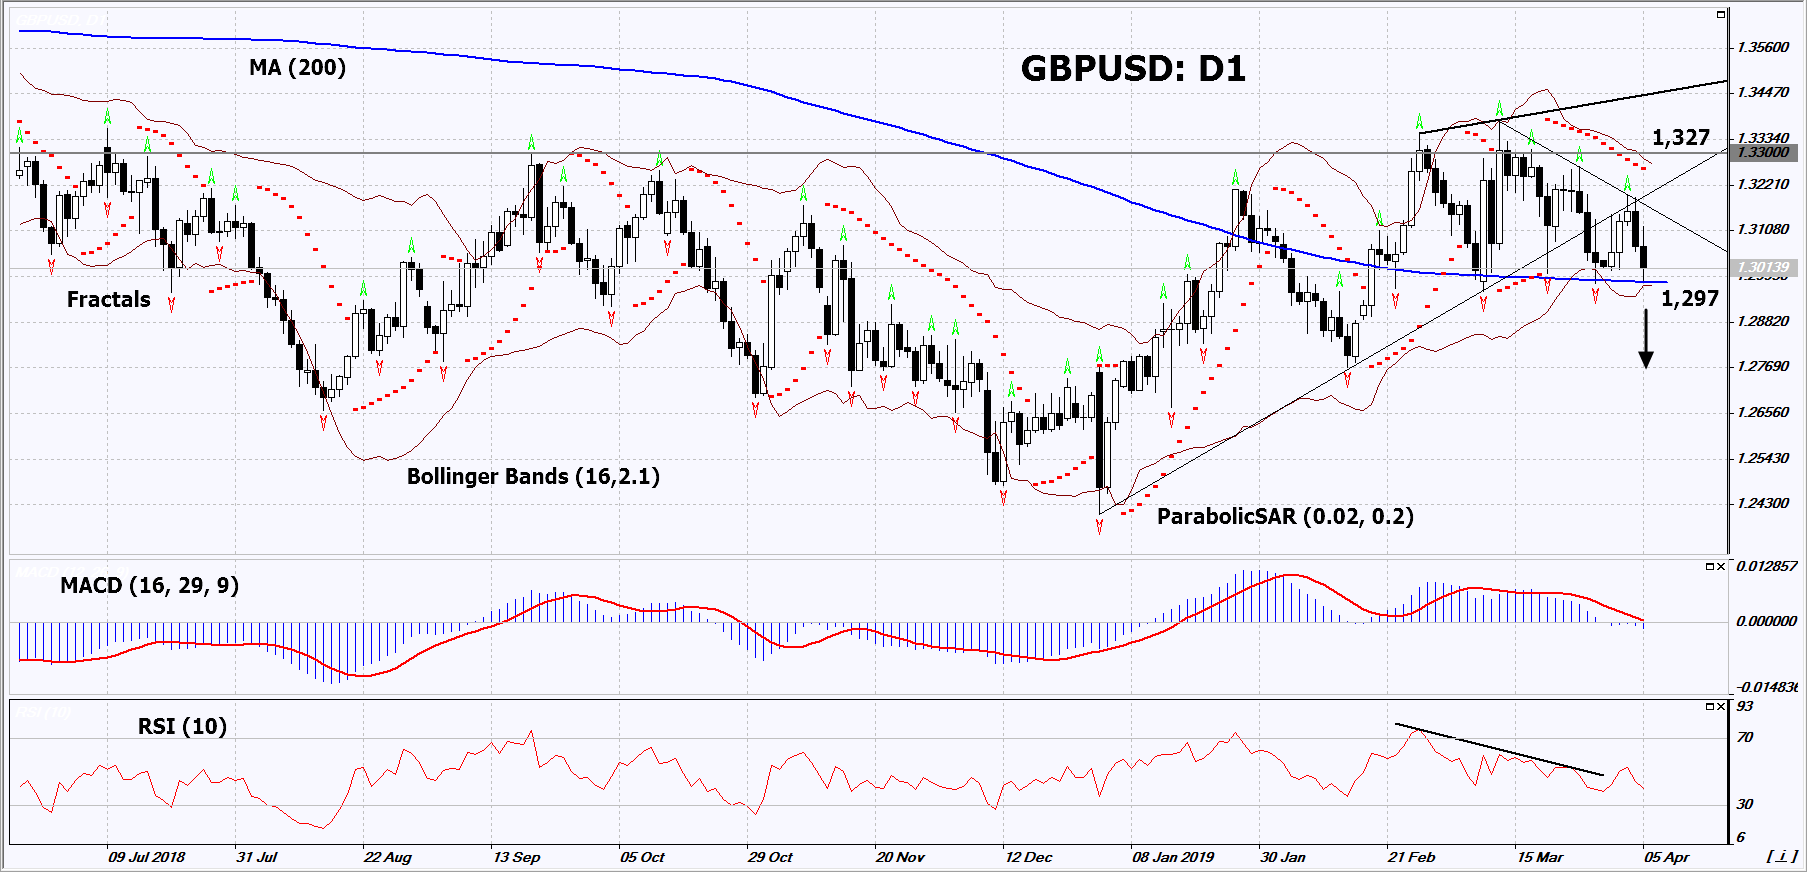
On the daily timeframe, GBPUSD: D1 is trying to leave the triangle and move downward. Most technical analysis indicators formed sell signals. The price decrease is possible if Brexit turns out to be unfavorable for the UK.
- The Parabolic Indicator gives a bearish signal.
- The Bollinger bands have narrowed, which indicates low volatility. The upper band is titled down.
- The RSI indicator is below 50. It has formed a negative divergence.
- The MACD indicator gives a bearish signal.
The bearish momentum may develop in case GBPUSD falls below its last fractal low, the 200-day moving average line and the last fractal low at 1.297. This level may serve as an entry point. The initial stop loss may be placed above the two last fractal highs, the Parabolic signal and the upper Bollinger band at 1.327. After opening the pending order, we shall move the stop to the next fractal high following the Bollinger and Parabolic signals. Thus, we are changing the potential profit/loss to the breakeven point. More risk-averse traders may switch to the 4-hour chart after the trade and place there a stop loss moving it in the direction of the trade. If the price meets the stop level (1.327) without reaching the order (1.297), we recommend to close the position: the market sustains internal changes that were not taken into account.
Summary of technical analysis
| Position | Sell |
| Sell stop | Below 1.297 |
| Stop loss | Above 1.327 |
Explore our
Trading Conditions
- Spreads from 0.0 pip
- 30,000+ Trading Instruments
- Stop Out Level - Only 10%
Ready to Trade?
Open Account Note:
This overview has an informative and tutorial character and is published for free. All the data, included in the overview, are received from public sources, recognized as more or less reliable. Moreover, there is no guarantee that the indicated information is full and precise. Overviews are not updated. The whole information in each overview, including opinion, indicators, charts and anything else, is provided only for familiarization purposes and is not financial advice or а recommendation. The whole text and its any part, as well as the charts cannot be considered as an offer to make a deal with any asset. IFC Markets and its employees under any circumstances are not liable for any action taken by someone else during or after reading the overview.
