- Analytics
- Technical Analysis
Google Technical Analysis - Google Trading: 2019-05-31
Slowing revenue growth bearish for Alphabet
Alphabet price dropped after company reported slowing first quarter revenue. Will the Alphabet price continue declining?
Google’s parent Alphabet shares dropped over 7% as the company reported weaker than expected first quarter revenue a month ago. Google report showed company’s growth decelerated after consistently expanding at 20% or more in prior periods. Revenue increased 17%, down from 28% growth a year earlier, and advertising sales rose 15%, down from 24% a year ago. The slowdown was attributed to slower growth in paid clicks: 39% in Q1 from the year-ago quarter, after 66% increase in the fourth quarter of 2018 and 62% in the third quarter. It was the second straight disappointing quarterly report for Alphabet. The stock has struggled to recover since then. Slowing growth is bearish for Alphabet price.
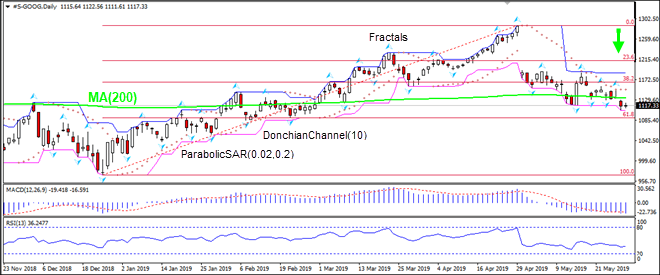
On the daily timeframe the S-GOOG: D1 has breached below the 200-day moving average MA(200) and is falling toward Fibonacci 61.8. This is bearish.
- The Parabolic indicator gives a sell signal.
- The Donchian channel indicates downtrend: it has widened down.
- The MACD indicator gives a bearish signal: it is below the signal line and the gap is widening.
- The RSI oscillator is falling but has not breached into the oversold zone yet.
We believe the bearish momentum will continue after the price breaches below the lower boundary of Donchian channel at 1107.60. This level can be used as an entry point for placing a pending order to sell. The stop loss can be placed above the fractal high at 1187.58. After placing the order, the stop loss is to be moved every day to the next fractal high, following Parabolic signals. Thus, we are changing the expected profit/loss ratio to the breakeven point. If the price meets the stop loss level (1187.58) without reaching the order (1107.60), we recommend cancelling the order: the market has undergone internal changes which were not taken into account.
Technical Analysis Summary
| Position | Sell |
| Sell stop | Below 1107.60 |
| Stop loss | Above 1187.58 |
Explore our
Trading Conditions
- Spreads from 0.0 pip
- 30,000+ Trading Instruments
- Stop Out Level - Only 10%
Ready to Trade?
Open Account Note:
This overview has an informative and tutorial character and is published for free. All the data, included in the overview, are received from public sources, recognized as more or less reliable. Moreover, there is no guarantee that the indicated information is full and precise. Overviews are not updated. The whole information in each overview, including opinion, indicators, charts and anything else, is provided only for familiarization purposes and is not financial advice or а recommendation. The whole text and its any part, as well as the charts cannot be considered as an offer to make a deal with any asset. IFC Markets and its employees under any circumstances are not liable for any action taken by someone else during or after reading the overview.
