- Analytics
- Technical Analysis
European Index Technical Analysis - European Index Trading: 2015-10-19
ECB may expand economic stimulus
European stock indices are on the increase due to the investors optimism. They believe the ECB quantitative easing programme and the low rates policy will stimulate the economic growth. Uncertainty around the early interest rates hike provokes the US stock market growth which causes the general uptrend of the global stock market. How long will this positive trend last?
According to the final estimate, in Eurozone the September Consumer Price Index lost 0.1% which is far below the ECB target level of +1.1%. The real deflation may stimulate the expansion of the QE programme, said the member of the ECB governing council Ewald Nowotny on Thursday. Meanwhile, the expectations of the Fed rate hike are considerably low. The fed funds futures market is pricing in a 56% chance the rates will be increased in March 2016 which supports the global stock markets. In this overview we would like to offer you a personal composite instrument (PCI), comprising three European stock indices: DAX, CAC and FTSE. Its quote part is represented by EURUSD pair. Remember, that the following ECB meeting is due on October 22, where the policymakers may discuss more precisely the matter of monetary stimulus.
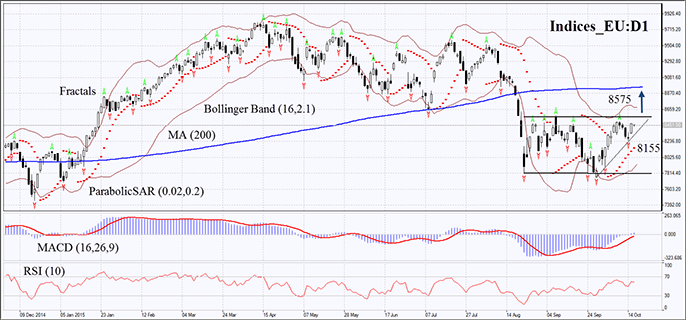
On the daily chart Indices_EU:D1 is moving upwards within the neutral trend, almost verging the upper trend line. The MACD and Parabolic indicator give buy signals. RSI is above 50, but haven’t yet reached the overbought zone. The Bollinger Bands are contracting which may mean quite low volatility. The bullish momentum may develop if the PCI prices surpass the resistance of the flat. Such a breakout may serve the point of entry at 8575. The initial risk limit is possible below the Parabolic signal and the last Bill Williams fractal low at 8155. Having opened the pending order we shall move the stop to the next fractal low following the Parabolic and Bollinger signals. Thus, we are changing the probable profit/loss ratio to the breakeven point. The most risk-averse traders may switch to the 4-hour chart after the trade and place there a stop-loss moving it in the direction of the trade. If the price meets the stop-loss level at 8155 without reaching the order at 8575, we recommend cancelling the position: the market sustains internal changes which were not taken into account.
| Position | Buy |
| Buy stop | above 8575 |
| Stop loss | below 8155 |
Explore our
Trading Conditions
- Spreads from 0.0 pip
- 30,000+ Trading Instruments
- Stop Out Level - Only 10%
Ready to Trade?
Open Account Note:
This overview has an informative and tutorial character and is published for free. All the data, included in the overview, are received from public sources, recognized as more or less reliable. Moreover, there is no guarantee that the indicated information is full and precise. Overviews are not updated. The whole information in each overview, including opinion, indicators, charts and anything else, is provided only for familiarization purposes and is not financial advice or а recommendation. The whole text and its any part, as well as the charts cannot be considered as an offer to make a deal with any asset. IFC Markets and its employees under any circumstances are not liable for any action taken by someone else during or after reading the overview.
