- Analytics
- Technical Analysis
Hog Futures Technical Analysis - Hog Futures Trading: 2018-02-02
Pork market participants fear China's counter measures
A day or two ago, the United States increased the duties on the solar panel and washing machine imports. In fact, these measures are directed against the Chinese products, since it is the main supplier. Will the pork quotes decrease in case of China's counter measures?
China is the world's largest pork consumer, and the US and the EU are its main exporters to China. According to the U.S. Meat Export Federation, the total pork shipments from the US abroad increased by 6.7% in November 2017, compared to the same period in 2016 and reached a historic high of 2.23 mln tonnes. China is ranked the 3rd in the US pork exports. Another risk of a demand reduction is Trump’s plans to terminate the North American Free Trade Agreement (NAFTA). In response, Canada and Mexico may reduce the purchases of any goods from the US and, in particular, of pork. Note that Mexico is ranked the 1st in the US export of pork, and Canada - the 4th (Japan is the 2nd). Note that, according to the US Department of Agriculture, as of December 1, 2017, the number of pigs in the US reached the high since 1943 and amounted to 73.2 mln units.
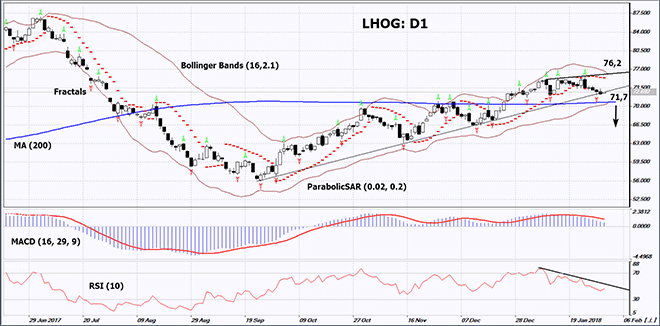
On the daily timeframe, LHOG: D1 approached the support level of the rising trend. A downward correction is possible in case of a decrease in pork exports and an increase in its production.
- The Parabolic indicator gives a bearish signal.
- The Bollinger bands have narrowed, which means lower volatility. They are tilted down.
- The RSI indicator is below 50. It has formed a negative divergence.
- The MACD indicator gives a bearish signal.
The bearish momentum may develop in case LHOG drops below the support line of the rising trend and the three last fractal lows at 71.7. This level may serve as an entry point. The initial stop loss may be placed above the last fractal high, the 7-month high, the upper Bollinger band and the Parabolic signal at 76.2. After opening the pending order, we shall move the stop to the next fractal high following the Bollinger and Parabolic signals. Thus, we are changing the potential profit/loss to the breakeven point. More risk-averse traders may switch to the 4-hour chart after the trade and place there a stop loss moving it in the direction of the trade. If the price meets the stop level at 76.2 without reaching the order at 71.7, we recommend cancelling the position: the market sustains internal changes that were not taken into account.
Summary of technical analysis
| Position | Sell |
| Sell stop | below 71,7 |
| Stop loss | above 76,2 |
Explore our
Trading Conditions
- Spreads from 0.0 pip
- 30,000+ Trading Instruments
- Stop Out Level - Only 10%
Ready to Trade?
Open Account Note:
This overview has an informative and tutorial character and is published for free. All the data, included in the overview, are received from public sources, recognized as more or less reliable. Moreover, there is no guarantee that the indicated information is full and precise. Overviews are not updated. The whole information in each overview, including opinion, indicators, charts and anything else, is provided only for familiarization purposes and is not financial advice or а recommendation. The whole text and its any part, as well as the charts cannot be considered as an offer to make a deal with any asset. IFC Markets and its employees under any circumstances are not liable for any action taken by someone else during or after reading the overview.
