- Analytics
- Technical Analysis
Natural Gas Prices Technical Analysis - Natural Gas Prices Trading: 2015-11-11
Gas slightly up as winter approaches
Natural gas prices in the U.S. are edging up for the 2nd straight week as investors anticipate winter. Will the uptrend continue?
The U.S. weather services forecast a cold spell in the U.S. for a fortnight which may spur the demand for natural gas for heating. Gas prices hit a fresh 3-year low late October. Amid this, the natural gas net shorts increased for the 6th consecutive week as of November 3 on the NYMEX and ICE exchanges, reaching the 5-year high, according to the U.S. Commodity Futures Trading Commission. Several market participants expressed their view that cold weather may force traders to close some of the shorts, which, in its turn, will push the gas prices higher. On November 13 at 16:30 CET the weekly gas stockpiles will be released in the U.S. They are expected to increase to 66bn cu ft. which is 40% above the last year’s level and 3 times more than the average for the recent 5 years. If the forecast doesn’t work, the further gas price increase is possible in the U.S.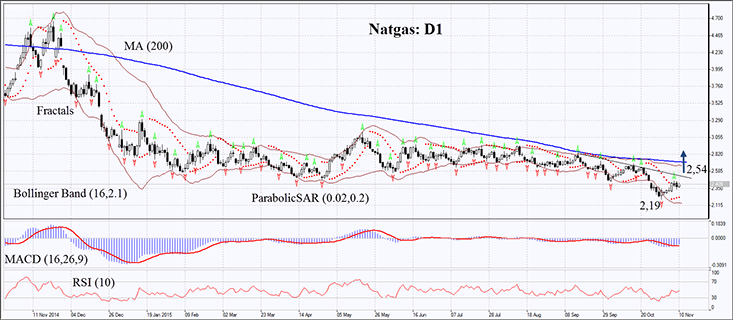
On the daily chart NATGAS: D1 is rising within the downtrend. The instrument is above its 200-day moving average. The Parabolic indicator and MACD have formed the buy signals. The RSI is neutral below 50, no divergence. The Bollinger bands have widened which may mean higher volatility. The bullish momentum may develop in case the natural gas price surpasses the last fractal high and resistance line at 2.54. This level may serve the point of entry. The initial risk-limit may be placed below the last fractal low and 3-year bottom at 2.19. Having opened the pending order we shall move the stop to the next fractal low following the Bollinger and Parabolic signals. Thus, we are changing the probable profit/loss ratio to the breakeven point. The most risk-averse traders may switch to the 4-hour chart after the trade and place there a stop-loss moving it in the direction of the trade. If the price meets the stop-loss level at 2.19 without reaching the order at 2.54, we recommend cancelling the position: the market sustains internal changes which were not taken into account.
| Position | Buy |
| Buy stop | above 2,54 |
| Stop loss | below 2,19 |
Explore our
Trading Conditions
- Spreads from 0.0 pip
- 30,000+ Trading Instruments
- Stop Out Level - Only 10%
Ready to Trade?
Open Account Note:
This overview has an informative and tutorial character and is published for free. All the data, included in the overview, are received from public sources, recognized as more or less reliable. Moreover, there is no guarantee that the indicated information is full and precise. Overviews are not updated. The whole information in each overview, including opinion, indicators, charts and anything else, is provided only for familiarization purposes and is not financial advice or а recommendation. The whole text and its any part, as well as the charts cannot be considered as an offer to make a deal with any asset. IFC Markets and its employees under any circumstances are not liable for any action taken by someone else during or after reading the overview.
