- Analytics
- Technical Analysis
NZD/USD Technical Analysis - NZD/USD Trading: 2017-10-27
Lower growth outlook bearish for New Zealand dollar
Policy proposals to limit immigration, tax capital gains and restrict foreign ownership of properties are expected to hurt growth outlook of New Zealand economy. Will the NZDUSD continue falling?
The Reserve Bank of New Zealand kept the official cash rate on hold at 1.75% at its September 28 meeting. Since then Labour and New Zealand First parties’ coalition government has been formed. The coalition has advocated policy changes like limiting immigration, taxing capital gains to curb property speculation and placing restrictions on foreign ownership of properties. New policies are seen as detrimental to future investment and economic growth outlook, weighing on New Zealand dollar.
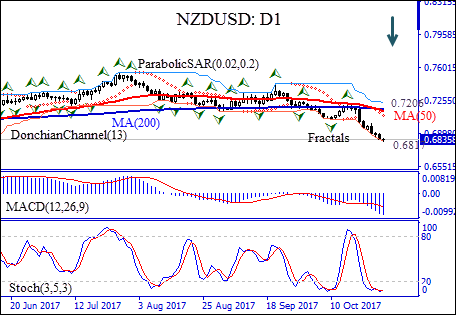
The NZDUSD: D1 accelerated the decline following the coalition formation between the Labour and New Zealand First parties on October 19. The 50-day and 200-day moving averages MA(50) and MA(200) have formed the bearish Death Cross chart pattern on daily timeframe.
- Parabolic indicator gives a sell signal.
- The Donchian channel indicates downtrend: it is tilted down.
- The MACD indicator gives a bearish signal: it is below the signal line and the gap is widening.
- The stochastic oscillator gives a bullish signal: it is in the oversold zone.
We believe the bearish momentum will continue after the price breaches below the lower Donchian boundary at 0.6817. A pending order to sell can be placed below that level. The stop loss can be placed above the last fractal high at 0.7206. After placing the order, the stop loss is to be moved every day to the next fractal high, following Parabolic signals. Thus, we are changing the probable profit/loss ratio to the breakeven point. The most risk-averse traders may switch to the 4-hour chart after the trade and place there a stop-loss moving it in the direction of the trade. If the price meets the stop loss level (0.7206) without reaching the order (0.6817), we recommend canceling the position: the market sustains internal changes which were not taken into account.
Technical Analysis Summary
| Position | Buy |
| Sell stop | Below 0.6817 |
| Stop loss | Above 0.7206 |
Explore our
Trading Conditions
- Spreads from 0.0 pip
- 30,000+ Trading Instruments
- Stop Out Level - Only 10%
Ready to Trade?
Open Account Note:
This overview has an informative and tutorial character and is published for free. All the data, included in the overview, are received from public sources, recognized as more or less reliable. Moreover, there is no guarantee that the indicated information is full and precise. Overviews are not updated. The whole information in each overview, including opinion, indicators, charts and anything else, is provided only for familiarization purposes and is not financial advice or а recommendation. The whole text and its any part, as well as the charts cannot be considered as an offer to make a deal with any asset. IFC Markets and its employees under any circumstances are not liable for any action taken by someone else during or after reading the overview.
