- Analytics
- Technical Analysis
USD/CAD Technical Analysis - USD/CAD Trading: 2016-04-22
Canadian dollar strength endures
Canadian dollar has been strengthening as Canadian economy adjusts to oil price shock. Oil prices are rebounding after hitting multi-year lows in January. The inflation and retail sales reports today are expected to indicate declines both in consumer prices and sales figures. Will the Canadian dollar continue strengthening against the US dollar?
As Canadian dollar continues strengthening Bank of Canada left the interest rate unchanged at 0.5% on April 15, noting that first quarter GDP growth appears to have been unexpectedly strong. The GDP rose 0.6% in January, a fourth consecutive monthly increase. Manufacturing, retail trade, mining and oil and gas were major contributors to growth in January. However, policy makers forecast a lower estimated range for potential GDP growth in 2016 as investments decline in energy sector and foreign demand grows at slower rates than previously estimated. The Bank now projects real GDP growth of 1.7% in 2016. And while prices of oil and other commodities are rising and are above levels projected by the Bank in January, the central bank expects inflation will continue easing before returning to 2%. The Consumer Price Index rose 1.4% year-on-year in February of 2016, slowing from a 14-month high of 2% in January. Nevertheless, the Canadian dollar is strengthening against the US dollar as the price of oil, the main energy commodity which accounted for about 18% of Canada’s exports in January 2015, continues to recover from February lows. Statistics Canada will be releasing inflation and retail sales data today at 14:30 CET. Better than expected results will contribute to Canadian dollar’s strength as both the headline inflation for March and retail sales for February are expected to decline. Next major economic data will be released on May 4 and May 6 when the Balance of Trade for March and Unemployment Rate for April will be published. The next policy meeting of the Bank of Canada is scheduled for May 25.
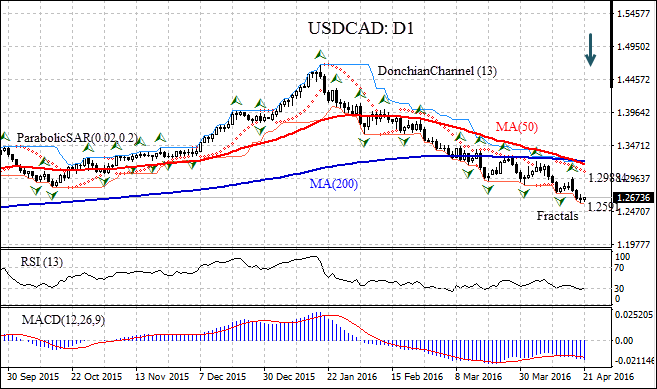
USDCAD: D1 has been trading with a negative bias on the daily timeframe since the end of January as oil prices started rebounding from multi-year lows. The pair has declined below the last fractal low. The 50-day moving average MA(50) continues to decline after the Death Cross was formed as the MA(50) crossed below the 200-day moving average MA(200) on Tuesday. This is a bearish signal. The Donchian channel is tilted downward, which is also a bearish signal. The Parabolic indicator gives a sell signal. The RSI oscillator is edging higher after crossing into the oversold zone, which doesn’t exclude continuation of the downtrend. The MACD indicator is below the signal line and the zero level which is a bearish signal. We expect the bearish momentum will continue after the price closes below the lower Donchian bound at 1.2591. It can serve as an entry point for a pending order to sell. The stop loss can be placed above the last fractal high at 1.29884. After placing the pending order, the stop loss is to be moved to the next fractal high, following Parabolic signals. Thus, we are changing the probable profit/loss ratio to the breakeven point. If the price meets the stop loss level at 1.29884 without reaching the order, we recommend canceling the position: the market sustains internal changes which were not taken into account.
| Position | Sell |
| Sell stop | below 1.2591 |
| Stop loss | above 1.29884 |
Explore our
Trading Conditions
- Spreads from 0.0 pip
- 30,000+ Trading Instruments
- Stop Out Level - Only 10%
Ready to Trade?
Open Account Note:
This overview has an informative and tutorial character and is published for free. All the data, included in the overview, are received from public sources, recognized as more or less reliable. Moreover, there is no guarantee that the indicated information is full and precise. Overviews are not updated. The whole information in each overview, including opinion, indicators, charts and anything else, is provided only for familiarization purposes and is not financial advice or а recommendation. The whole text and its any part, as well as the charts cannot be considered as an offer to make a deal with any asset. IFC Markets and its employees under any circumstances are not liable for any action taken by someone else during or after reading the overview.
