- Analytics
- Technical Analysis
USD/JPY Technical Analysis - USD/JPY Trading: 2016-12-27
Significant economic data will come out in Japan
On Tuesday early in the morning the inflation data and household spending for November will come out in Japan. We believe they may make yen a bit stronger. Will USDJPY chart fall?
Due to preliminary forecasts, household spending rose in Japan in November for the first time since this February. This may revive the economy. Moreover, despite the expected same pace of core deflation year over year, it may fall in November to -0.3% from -0.4% in October 2016. The Bank of Japan aims at fighting deflation and reaching 2% inflation. Weak consumer confidence for December is expected to come out in US on Tuesday which may support the yen rate against the US dollar. Manufacturing production for November will come out in Japan on Wednesday. According to forecasts, they may be positive for the yen. Next significant data will come only on January 4, 2017.
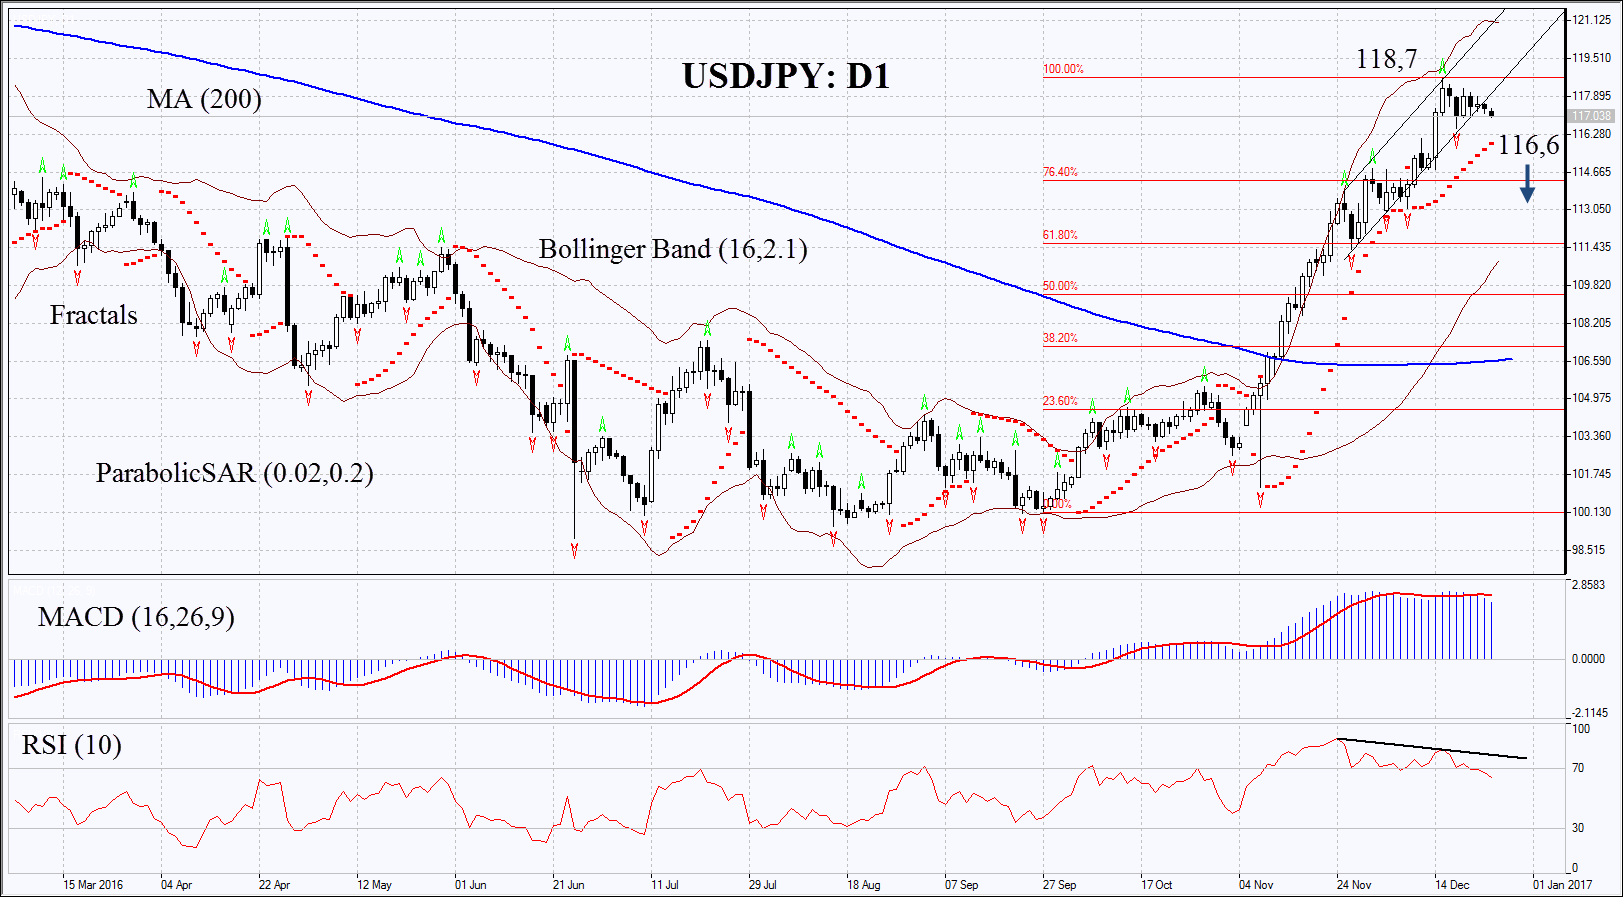
On the daily chart USDJPY: D1 is trending upwards. It hit a 11-month high two weeks ago. Now the pace of growth has slowed down and several technical indicators point at the chance of downward correction. Further strengthening of yen is possible in case of positive economic data in Japan and negative in US.
- Parabolic gives bullish signals which may serve an additional level of support. In such a case the price shall fall below the support to open a position.
- Bollinger bands have widened which means higher volatility.
- RSI has left the overbought zone having formed negative divergence.
- MACD gives bearish signals.
The bearish momentum may develop in case USDJPY falls below the last fractal low at 116.6. This level may serve the point of entry. The initial stop-loss may be placed above the 11-month high at 118.7. Having opened the pending order we shall move the stop to the next fractal high following the Parabolic and Bollinger signals. Thus, we are changing the probable profit/loss ratio to the breakeven point. The most risk-averse traders may switch to the 4-hour chart after the trade and place there a stop-loss moving it in the direction of the trade. If the price meets the stop-loss level at 118.7 without reaching the order at 116.6, we recommend cancelling the position: the market sustains internal changes which were not taken into account.
Summary of technical analysis
| Position | Sell |
| Sell stop | below 116.6 |
| Stop loss | above 118.7 |
Explore our
Trading Conditions
- Spreads from 0.0 pip
- 30,000+ Trading Instruments
- Stop Out Level - Only 10%
Ready to Trade?
Open Account Note:
This overview has an informative and tutorial character and is published for free. All the data, included in the overview, are received from public sources, recognized as more or less reliable. Moreover, there is no guarantee that the indicated information is full and precise. Overviews are not updated. The whole information in each overview, including opinion, indicators, charts and anything else, is provided only for familiarization purposes and is not financial advice or а recommendation. The whole text and its any part, as well as the charts cannot be considered as an offer to make a deal with any asset. IFC Markets and its employees under any circumstances are not liable for any action taken by someone else during or after reading the overview.
