- Analytics
- Technical Analysis
WHEAT Technical Analysis - WHEAT Trading: 2019-02-06
Wheat reserves fell in Canada
The national statistical agency Statistics Canada reported a reduction in Canadian wheat reserves. Will Wheat prices rise?
In December 2018, total wheat reserves in Canada amounted to 23.2 million tons. This is by 0.2% less than the level of December 2017 and by 3.6% - the level of December 2016. An additional factor for the growth may be the results of an international tender to purchase wheat, announced by Jordan in the amount of 120 thousand tons. However, it could purchase only half of the desired - 60 thousand tons. Theoretically, this may be a sign of insufficient supply of grain in the world market. Now the Ministry of Agriculture of Japan announced a tender to purchase 131.2 thousand tons of wheat. Its results may be announced on Thursday. On Friday, February 8, the US Department of Agriculture will publish forecasts on US and world reserves of corn, soybeans and wheat, as well as other data at 17-00 GMT. This information may affect quotations, especially, taking into account the already announced decline in wheat reserves in Canada.
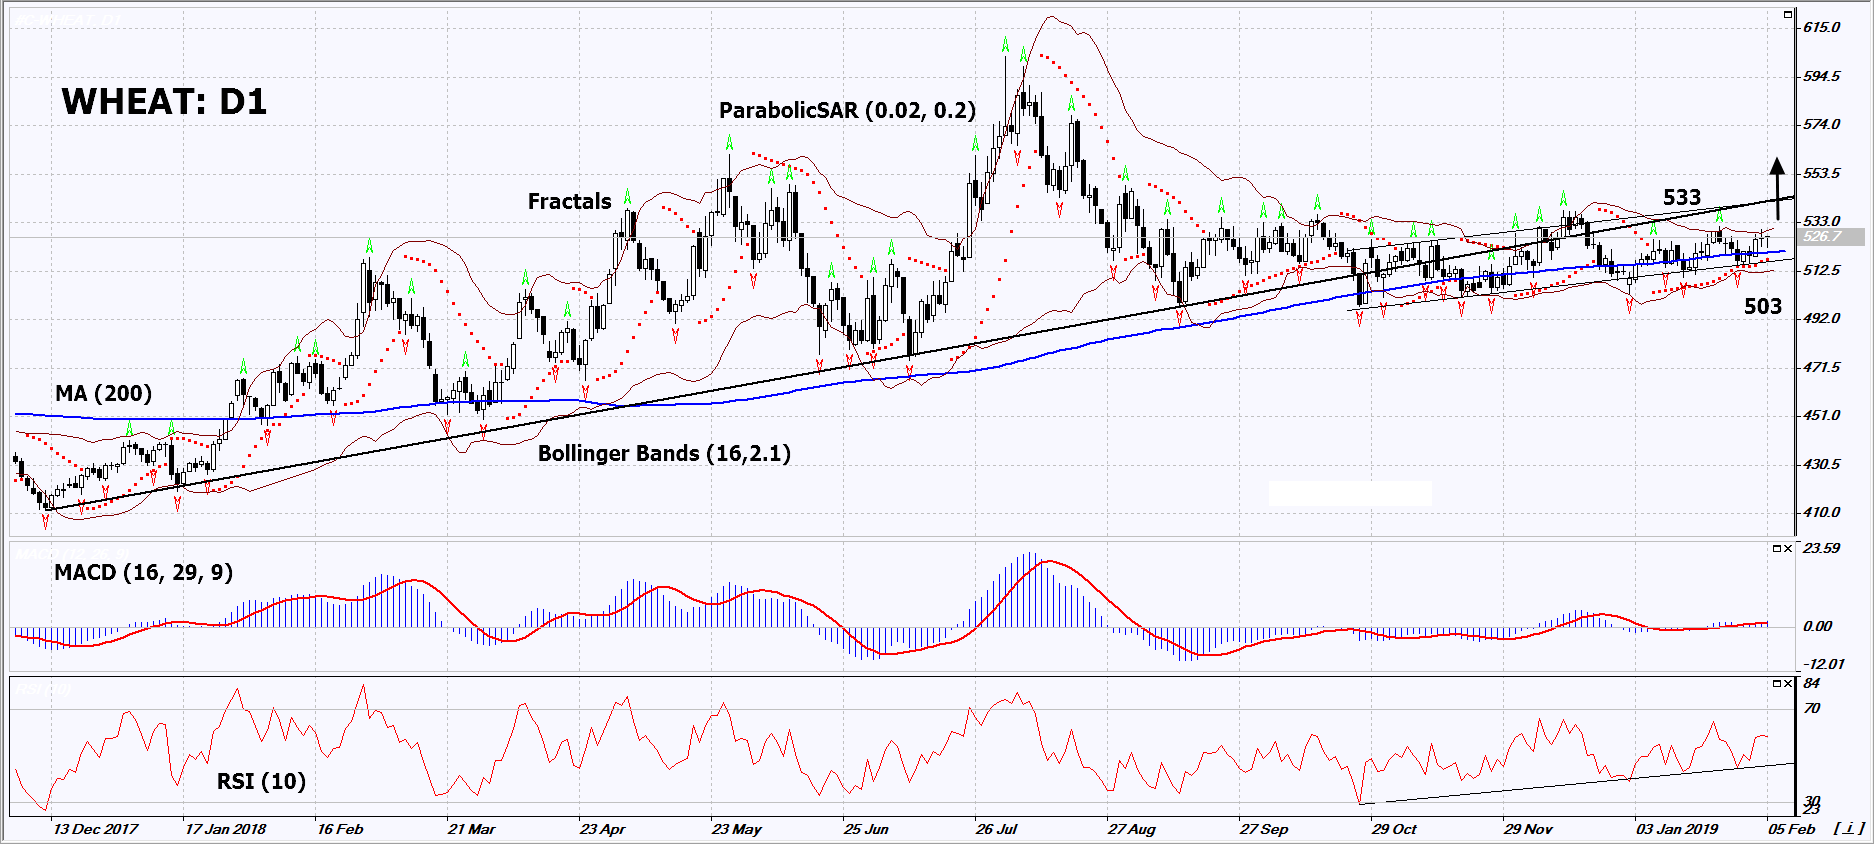
On the daily timeframe, Wheat: D1 is in a long-term uptrend. A number of technical analysis indicators formed buy signals. The further price growth is possible in case of an increase in world demand amid a decrease in reserves of producing countries.
- The Parabolic indicator gives a bullish signal.
- The Bollinger bands have narrowed, which indicates low volatility. Both Bollinger bands are titled upwards.
- The RSI indicator is above 50. No divergence.
- The MACD indicator gives a bullish signal.
The bullish momentum may develop in case Wheat exceeds its last fractal high and the upper Bollinger band at 533. This level may serve as an entry point. The initial stop loss may be placed below the 4 last fractal lows, the Parabolic signal and the lower Bollinger band at 503. After opening the pending order, we shall move the stop to the next fractal low following the Bollinger and Parabolic signals. Thus, we are changing the potential profit/loss to the breakeven point. More risk-averse traders may switch to the 4-hour chart after the trade and place there a stop loss moving it in the direction of the trade. If the price meets the stop level (503) without reaching the order (533), we recommend to close the position: the market sustains internal changes that were not taken into account.
Summary of technical analysis
| Position | Buy |
| Buy stop | Above 533 |
| Stop loss | Below 503 |
Explore our
Trading Conditions
- Spreads from 0.0 pip
- 30,000+ Trading Instruments
- Stop Out Level - Only 10%
Ready to Trade?
Open Account Note:
This overview has an informative and tutorial character and is published for free. All the data, included in the overview, are received from public sources, recognized as more or less reliable. Moreover, there is no guarantee that the indicated information is full and precise. Overviews are not updated. The whole information in each overview, including opinion, indicators, charts and anything else, is provided only for familiarization purposes and is not financial advice or а recommendation. The whole text and its any part, as well as the charts cannot be considered as an offer to make a deal with any asset. IFC Markets and its employees under any circumstances are not liable for any action taken by someone else during or after reading the overview.
