- Innovations
- Articles on application of PCI
- Spread Trading
DE 30 against FR 40 - Comparing Stock Indices with PQM Method
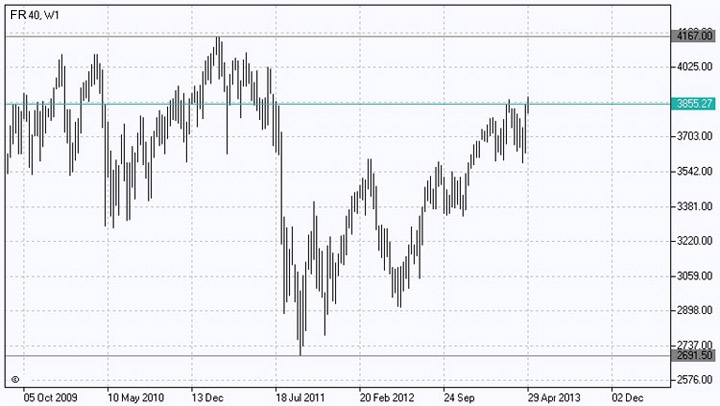
Eurozone consists of nearly two dozens of countries, each having its own economic characteristics. The sovereign debt crisis that erupted in the region has brought down stock markets of all countries. But the reaction could not be quantitatively the same everywhere. In this article we will try to investigate the behavior of the major German index DE 30 and the major French index FR 40, to compare their dynamics in order to determine the relative pace of recovery of each of them in the last several years.
The idea of comparing the two indices, DE 30 and FR 40, is based on the assumption that the German economy in recent years has been the locomotive of the euro zone, almost a guarantor of stability in the region. The demand for German government bonds has helped to reduce the cost of borrowing - in Germany it has been and remains one of the lowest in the euro area. Economic growth in Germany also has been remaining higher than the rate in France, which faced more difficulties to cope with the consequences of the financial crisis in 2008 and the European debt crisis. In general, we assume that in the more stable Germany more healthy stock market will be. DE 30 will be an indicator of German stock market.
According to individual charts, both indices have shown rather mixed dynamics since 2009. In the year 2011 there was a significant drop, when Europe's sovereign debt crisis erupted. But it was the German DE 30, not French FR 40, that was able to fully recover after falling in 2011.

It will be aslo interesting to compare the behavior of the indices relative to each other. Let’s draw a chart of a PCI, including DE 30 in the Base portfolio and FR 40 – in the Quoted. As a result we will obtain a quite stable growing structure, which shows that DE 30 has been systematically beating FR 40. It should be noted that during this period declines have been observed as well, but the overall trend is upward sloping. This confirms our assumption about a higher performance of the German stock market during this period.
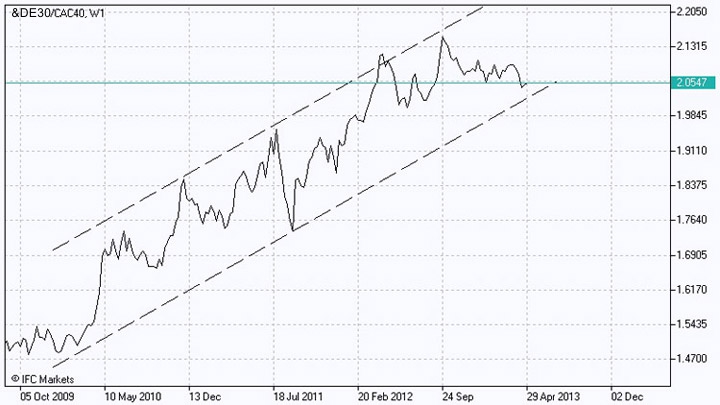
A closer look at the chart DE 30/FR 40 allows to reveal relative cyclicality or seasonality of fluctuations, taking place in an upward channel for already four years. Moreover local highs on the chart (of closing prices) are observed every six months at the beginning of summer and at the beginning of winter, and local lows - in the early fall and early spring. However, the cycle has narrowed a little in the last year. Local peaks correspond to points when DE 30 had the maximum value in relation to FR 40 during this period. Conversely, local lows correspond to relatively low values of the ratio DE 30/FR 40.
With the PCI toolset there are wide opportunities for comparison of various stock indices. Indices combine assets that have common characteristics, whether geographical ties, company size, economic sector, etc. Differences in the direction, reaction to one macroeconomic factor, speed of movement of various classes of assets - all these can be reflected in the chart of the PCI, ready for a serious analysis, including with the use of technical indicators.
Previous articles
- Performance of Japanese stock market versus the US stock market
- Comparing the performance of German stock market versus US stock market
- Arbitrage Trading | FCATTLE/SOYB - The Efficiency Analysis
- PCI: Commodity Futures - Coffee vs Cocoa
- PCI on Agricultural Futures: Wheat Futures and Feeder Cattle
- New Corporate Report - Google Stocks, Apple Stocks