- Innovations
- Articles on application of PCI
- Spread Trading
New Corporate Report - Google Stocks, Apple Stocks
In the previous review , we introduced you to the capabilities of the NetTradeX terminal for creation of synthetic instruments through Portfolio Quothing Method PQM. As an example, we used the shares of Google and Apple companies.
Making an express analysis of both companies, we have assumed that Apple stock will go up slower and go down faster compared to Google shares at least until the annual reports. Then we created a personal composite instrument PCI - Google/Apple. Since the fundamental data are the basis of the express analysis, we decided to consider their changes.
In late January, Google and Apple have released another corporate accountability. The key trends noted in our previous report are kept. Financial indicators of Google continue to outpace the Apple performance at a comparable profitability level for both
companies.
Let us look at Google statements
| Forecast | Report | Forecast | Report | Forecast1 | Forecast2 | |||||
| Q4 Dec-12 | Q1 Mar-13 | Q2 Jun-13 | Q3 Sep-13 | Q4 Dec-13 | Q4 Dec-13 | 2013 | 2013 | Q1 Mar-14 | Q1 Mar-14 | |
| Return, $ billion | 12,16 | 13,97 | 14,11 | 14,89 | 16,68 | 16,86 | 59,65 | 59,83 | 16,24 | 16,58 |
| Yoy growth | 49,50% | 71,70% | 46,70% | 31,40% | 37,20% | 38,66% | 40,00% | 16,30% | 18,70% | |
| Earning per share, $ | 10,59 | 11,58 | 9,56 | 10,74 | 12,22 | 12,01 | 44,10 | 43,89 | 12,32 | 12,27 |
| Yoy growth | 11,50% | 14,90% | -5,50% | 18,90% | 15,40% | 13,41% | 10,20% | 6,40% | 6,00% | |
| Net profitability | 29,20% | 27,90% | 22,90% | 24,50% | 24,50% | 20,10% | 24,90% | 25,80% | 25,40% |
The company presented the data on the 4th quarter of 2013 and for the entire 2013. We believe that the main positive factor for the Google quotations has been the increase of revenues by 40% over one year and by 38.66 % for the 4th quarter. The earnings
per share decreased in the 4th quarter. In consequence of this, the net profitability has declined. However, the net earning per share for the year increased by 10.2 % due to growth in previous quarters at quite acceptable profitability 24.9 %.
We note the changes in the economic forecast indicators for 1st quarter of 2014. The Reuters Forecast1 was presented at the end of December last year and the Forecast 2 - in early February this year. Despite the apparent slowdown in revenue growth,
its revision was made upward. The Forecast reduction for earnings per share slightly decreased the profitability to quite acceptable level at 25.4 %.
| Forecast | Report | Forecast1 | Forecast2 | ||||||
| Q1 Dec-12 | Q2 Mar-13 | Q3 Jun-13 | Q4 Sep-13 | 2013 | Q1 Dec-13 | Q1 Dec-13 | Q2 Mar-14 | Q2 Mar-14 | |
| Revenue, $ billion | 54,51 | 43,60 | 35,32 | 37,47 | 170,91 | 57,46 | 57,59 | 45,51 | 43,57 |
| Yoy growth | 17,70% | 11,30% | 0,90% | 4,20% | 5,40% | 5,70% | 4,40% | -0,10% | |
| Earning per share, $ | 13,81 | 10,09 | 7,47 | 8,26 | 39,75 | 14,09 | 14,50 | 10,75 | 10,19 |
| Yoy growth | -0,40% | -18,00% | -19,80% | -4,70% | 2,00% | 5,00% | 6,50% | 0,90% | |
| Net profitability, % | 24,00% | 21,90% | 19,50% | 20,00% | 22,10% | 22,70% | 21,00% | 20,80% |
Apple introduced the statements for the 1st quarter of the new reporting year. As we have noted, the end of the year fiscal, Apple is on Sept. 30. Accordingly, it calls the 4th quarter of the calendar year, the 1st quarter of the year.
The revenue
and earning per share slightly exceeded of the analysts. It has not caused a rapid growth of stock price. In addition, the Reuters forecasts were markedly reduced on the 2nd quarter of 2014. The Forecast 2 in the table looks much worse than the Forecast
1. Apple expected revenues decreased by 4.3% and Earning per share by 5.2%.
Comparing quarterly data and forecasts for Google and Apple, we assume that the development of Google will go faster. Here we consider some reporting indicators of both companies for the year.
| Apple | ||
| Profitability of net operating cash flow, % | 31,2 | 31,4 |
| Operating profitability, % | 23,3 | 28,7 |
| Current assets/Short term liabilities | 4,6 | 1,7 |
| Revenue/Assets | 0,6 | 0,9 |
| Р/Е | 31,7 | 12,7 |
| Capitalization, $ billion | 381,9 | 457,2 |
Google has a much greater credit load, compared to Apple. Due to this, it has the same return on net operating cash flow at a lower operating profitability. The P/E coefficient of Apple is much lower, but we do not think it makes its shares more attractive. The current ratio (P/E Google) / (P/E Apple) or according to the table data 31.7 /12.7 is equal to 2.5. With the quarterly forecasts changes in earnings per share for both companies, extrapolated to the end of the year, forecast ratio can be reduced to 2.1. In our opinion, it is not increased so much compared to the beginning.
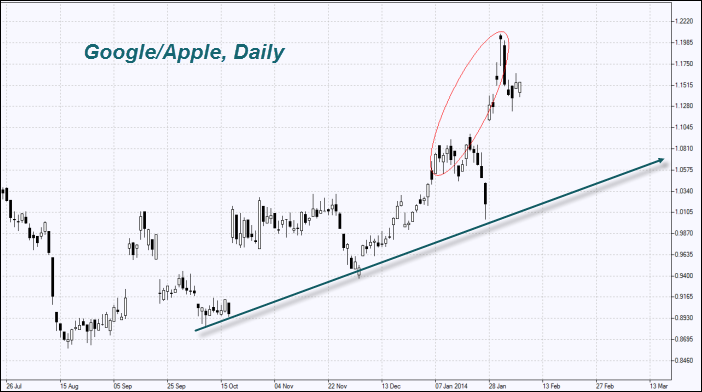
Since the first publication on our website on January 7, 2014 the Google/Apple PCI with a ratio of two P/E of 1.8 rose by 15% for January 31. We believe that when the forecast ratio (P/E Google)/(P/E Apple) is equal to 2.1 it also has the potential of growth and it is in an uptrend. In other words the arbitrage opportunities are kept.
Investors expect the Google net profit to grow rapidly, which ultimately can lead to a lower P/E ratio for the current buyers of shares. In turn, the Apple figures may stagnate.
On the basis of the second rapid analysis, we believe that the upward trend of the composite instrument PCI - Google/Apple may continue at least until the next quarterly report. Google will present its report on April 14, Apple on April 21.
Questions and suggestions:[email protected]Previous articles
- Performance of Japanese stock market versus the US stock market
- Comparing the performance of German stock market versus US stock market
- Arbitrage Trading | FCATTLE/SOYB - The Efficiency Analysis
- PCI: Commodity Futures - Coffee vs Cocoa
- PCI on Agricultural Futures: Wheat Futures and Feeder Cattle
- Spread Trading | Stock Trading - Google Stocks, Apple Stocks