- Innovations
- Articles on application of PCI
- Spread Trading
Spread Trading | Stock Trading - Google Stocks, Apple Stocks
We offer NetTradeX trading terminal capabilities for creating synthetic instruments through PQM method. Let us examine spread trading between two stocks. At first, it is necessary to analyze the financial status of the companies and their prospects.
Let us make an express evaluation based on Apple and Google.
| Apple | Nasdaq 100 | ||
| Growth of stocks for 2013 | 5,23% | 52,36% | 31,10% |
| Capitalization, bln $ | 493.97 | 367.70 | 4250 |
| P/E | 13,54 | 25,04 | 20,92 |
| P/B | 4 | 4,43 | 4,37 |
| Revenue for a year, bln $ | 170,91 | 50,175 | |
| Net income, bln $ | 37,037 | 10,788 |
| Q3 Jun-12 | Q4 Sep-12 | Q1 Dec-12 | Q2 Mar-13 | Q3 Jun-13 | Q4 Sep-13 | 2013 | Q1 Dec-13 | Q2 Mar-14 | |
| Revenue, bln $ | 35,023 | 35,966 | 54,512 | 43,603 | 35,323 | 37,472 | 170,91 | 57,463 | 45,508 |
| Growth % vs. Prior Yr. | 22.6% | 27.2% | 17.7% | 11.3% | 0.9% | 4.2% | 5.4% | 4.4% | |
| EPS | 9.320 | 8.670 | 13.810 | 10.090 | 7.470 | 8.260 | 39,75 | 14.085 | 10.747 |
| Growth % vs. Prior Yr. | 19.6% | 23.0% | -0.4% | -18.0% | -19.8% | -4.7% | 2.0% | 6.5% | |
| Net profitability% | 25.2% | 22.9% | 24.0% | 21.9% | 19.5% | 20.0% | 22.1% | 21.0% |
| Q2 Jun-12 | Q3 Sep-12 | Q4 Dec-12 | Q1 Mar-13 | Q2 Jun-13 | Q3 Sep-13 | Q4 Dec-13 | 2013 | Q1 Mar-14 | |
| Revenue, bln $ | 9,614 | 11,331 | 12,159 | 13,969 | 14,105 | 14,893 | 16,68 | 59,647 | 16,24 |
| Growth % vs. Prior Yr. | 39,00% | 50,90% | 49,50% | 71,70% | 46,70% | 31,40% | 37,20% | 16,30% | |
| EPS | 10,12 | 9,03 | 10,59 | 11,58 | 9,56 | 10,74 | 12,219 | 44,099 | 12,324 |
| Growth % vs. Prior Yr. | 15,80% | -7,10% | 11,50% | 14,90% | -5,50% | 18,90% | 15,40% | 6,40% | |
| Net income Margin% | 34,80% | 26,60% | 29,20% | 27,90% | 22,90% | 24,50% | 24,50% | 25,80% |
- As a result of express analysis, we can suppose that Apple stocks will rise in price more slowly and fall in price more quickly, as compared to Google stocks.
- At least, before the release of the annual report or maybe later, if it does not give any surprise.
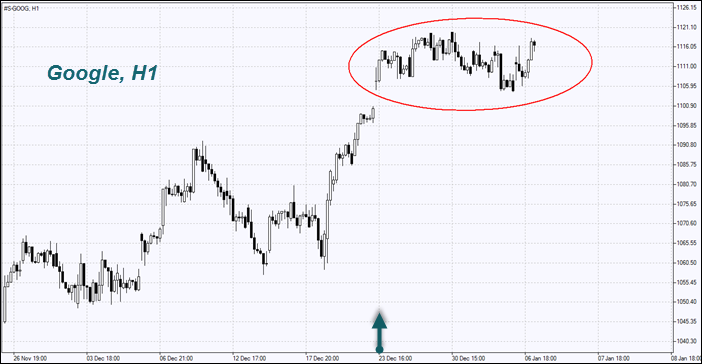
The date of express analysis is noted with an arrow. As can be seen from the graph, Google stocks were in neutral trend on the time graph, while it is better to use strongly pronounced trend.
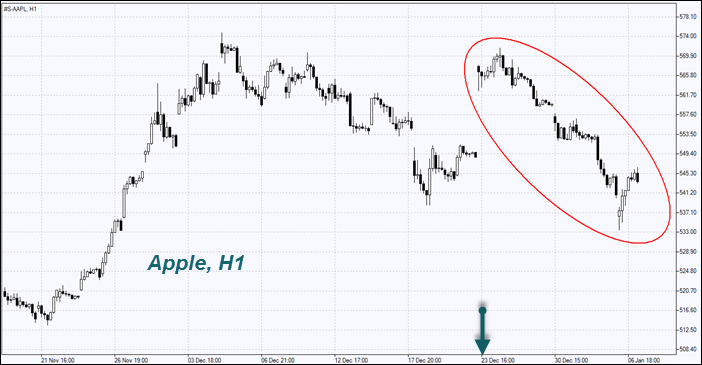
On time graph of Apple stock there is a descending trend. However, it was difficult to forecast it at the end of December. The company has negotiated a contract regarding the supply of mobiles to China. At the opening ceremony on December 23 there was a large gap up. As a result, it was closed and the quotations set a new local minimum. In our view, the analysis of the combined instrument &Google/Apple provides more opportunities for successful trading.
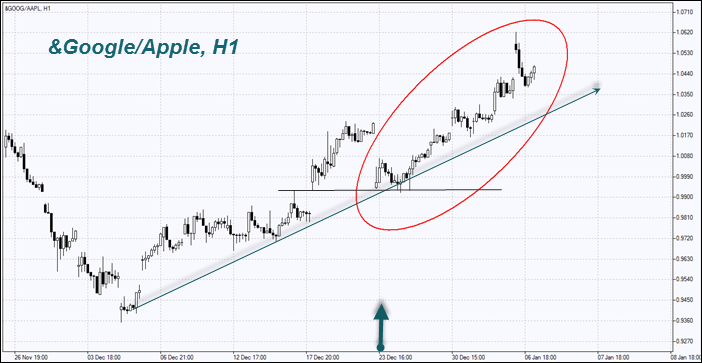
The combined instrument was in a growing trend with strongly pronounced support level. First, it is a trend line and secondly, the upper limit of the gap up. Besides, the opportunity of ascending trend continuation was confirmed by the fundamental express analysis of the both companies. In future, we will keep on familiarizing you with unique PQM Method. Now we want to mention its important feature. Theoretically, it is possible to open two or more multidirectional positions. However, only on NetTradeX trading terminal you will be able to analyze the dynamics of the created composite instrument by graphical analysis method. Questions and suggestions :[email protected]
Previous articles
- Performance of Japanese stock market versus the US stock market
- Comparing the performance of German stock market versus US stock market
- Arbitrage Trading | FCATTLE/SOYB - The Efficiency Analysis
- PCI: Commodity Futures - Coffee vs Cocoa
- PCI on Agricultural Futures: Wheat Futures and Feeder Cattle
- New Corporate Report - Google Stocks, Apple Stocks