- Analytics
- Technical Analysis
AUD Currency Index Technical Analysis - AUD Currency Index Trading: 2018-05-07
Good foreign trade data may accelerate the GDP growth
In this review we suggest considering the personal composite instrument (PCI) AUD_Index - currency index AUD. It is intended for analyzing and trading the Australian dollar AUD against other currencies traded on the Forex market. Will AUD_Index prices rise?
The growth of this PCI means the strengthening of the Australian dollar against the portfolio of currencies. Theoretically, good economic data may contribute to this. Trade surplus of Australia turned out to be the highest for 10 months and reached A$1.53 billion. Due to the commissioning of new LNG terminals, the export of liquefied natural gas in March increased by 8%. Market participants are now waiting for the revision of the Australian GDP for the first quarter of 2018 upwards. It will be published on June 6. An additional positive was an increase in the number of permits issued for the construction of houses in March by 2.6%. The Reserve Bank of Australia has raised its forecast for the GDP growth for this and next years. In 2018, it may amount to + 3.25% and in 2019 + 3.5%.
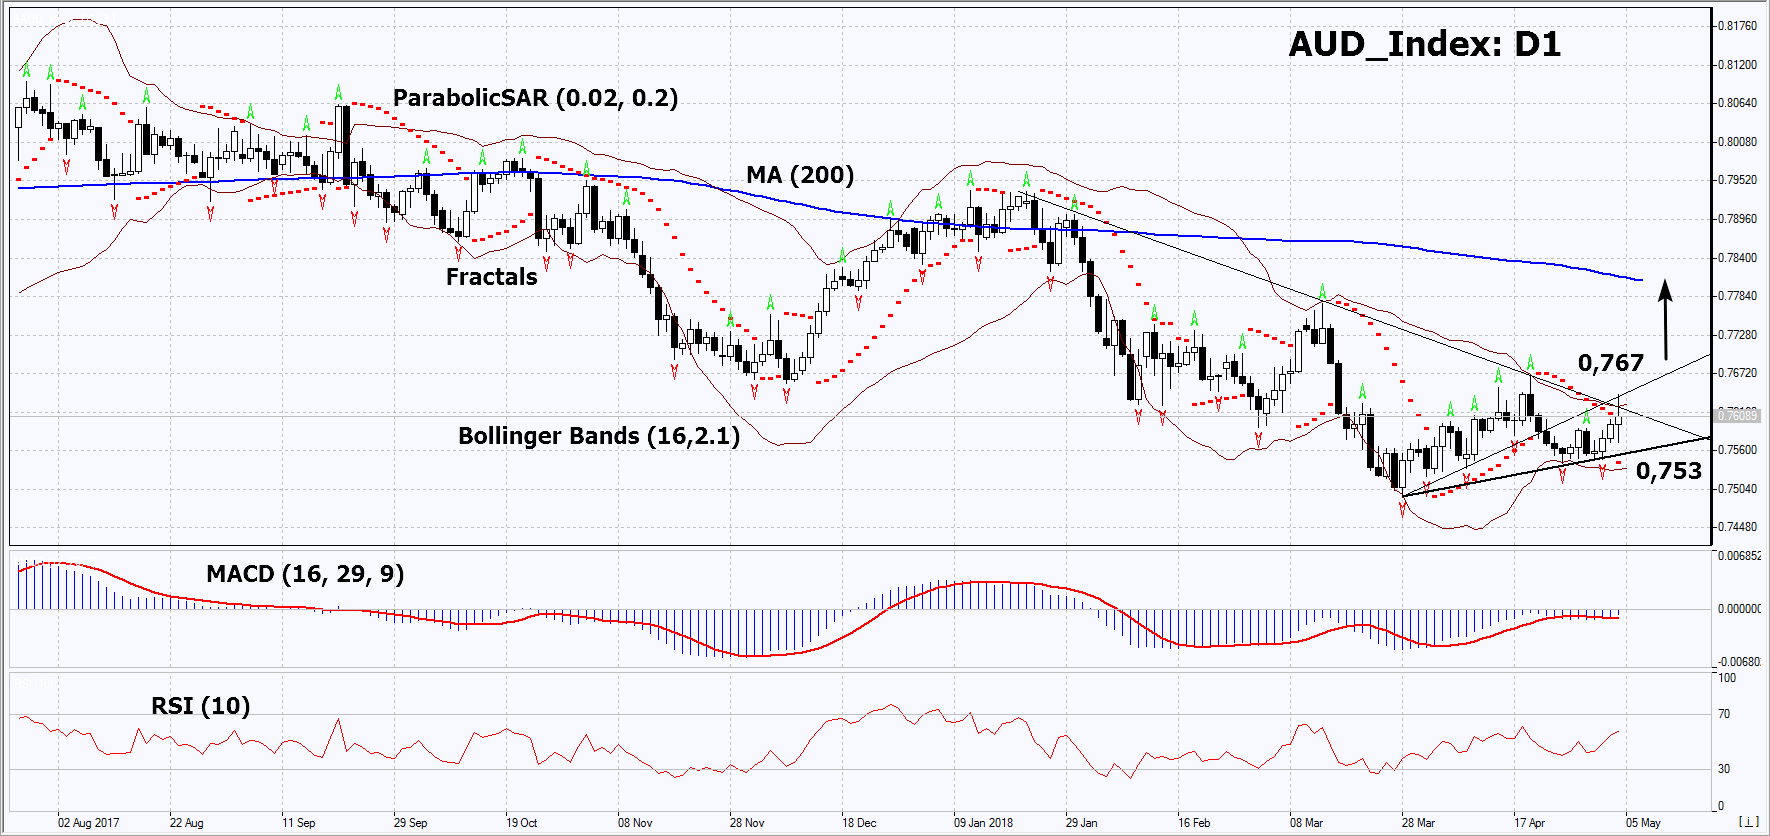
On the daily timeframe, AUD_Index: D1 is trying to breach above the resistance line of the downtrend. The further price increase is possible in case of the publication of positive economic data in Australia.
- The Parabolic indicator gives bullish signals.
- The Bollinger bands have narrowed, which indicates low volatility. They are titled upward.
- The RSI indicator is above 50. No divergence.
- The MACD indicator is giving bullish signals.
The bullish momentum may develop in case AUD_Index exceeds the two last fractal highs and the upper Bollinger band at 0,767. This level may serve as an entry point. The initial stop loss may be placed below the two last fractal lows, the historical low, the lower Bollinger band and the Parabolic signal at 0,753. After opening the pending order, we shall move the stop to the next fractal low following the Bollinger and Parabolic signals. Thus, we are changing the potential profit/loss to the breakeven point. More risk-averse traders may switch to the 4-hour chart after the trade and place there a stop loss moving it in the direction of the trade. If the price meets the stop level at 0,753 without reaching the order at 0,767, we recommend to close the position: the market sustains internal changes that were not taken into account.
Summary of technical analysis
| Position | Buy |
| Buy stop | Above 0,767 |
| Stop loss | Below 0,753 |
- Get Certificate

Note:
This overview has an informative and tutorial character and is published for free. All the data, included in the overview, are received from public sources, recognized as more or less reliable. Moreover, there is no guarantee that the indicated information is full and precise. Overviews are not updated. The whole information in each overview, including opinion, indicators, charts and anything else, is provided only for familiarization purposes and is not financial advice or а recommendation. The whole text and its any part, as well as the charts cannot be considered as an offer to make a deal with any asset. IFC Markets and its employees under any circumstances are not liable for any action taken by someone else during or after reading the overview.
