- Analytics
- Technical Analysis
AUD USD Technical Analysis - AUD USD Trading: 2018-05-14
Preparing for the publication of significant statistics
The Australian dollar may strengthen amid the decrease in the US dollar index. Will AUDUSD prices rise?
In early May, data on foreign trade for March 2018 were published in Australia. The positive trade balance increased almost twice compared to February and was the highest since May 2017. After that, the Australian dollar prices were more or less stabilized. On Friday, data on real estate market loans came out in Australia. Its volumes were reduced in accordance with the recommendations of the Reserve Bank, which believed that the real estate market is overheated. Its volumes were reduced in accordance with the recommendations of the Reserve Bank, which believed that the real estate market was overheated. This may become another positive factor for the Australian dollar. The dollar index fell amid a slight slowdown in inflation for April. This reduces the probability of a Fed rate hike. Nevertheless, according to federal funds futures, it can be still raised twice in the current year. This week, the data on retail sales in the US will be published on Tuesday and the data on the Australian labor market - on Thursday. They may affect the dynamics of AUDUSD prices.
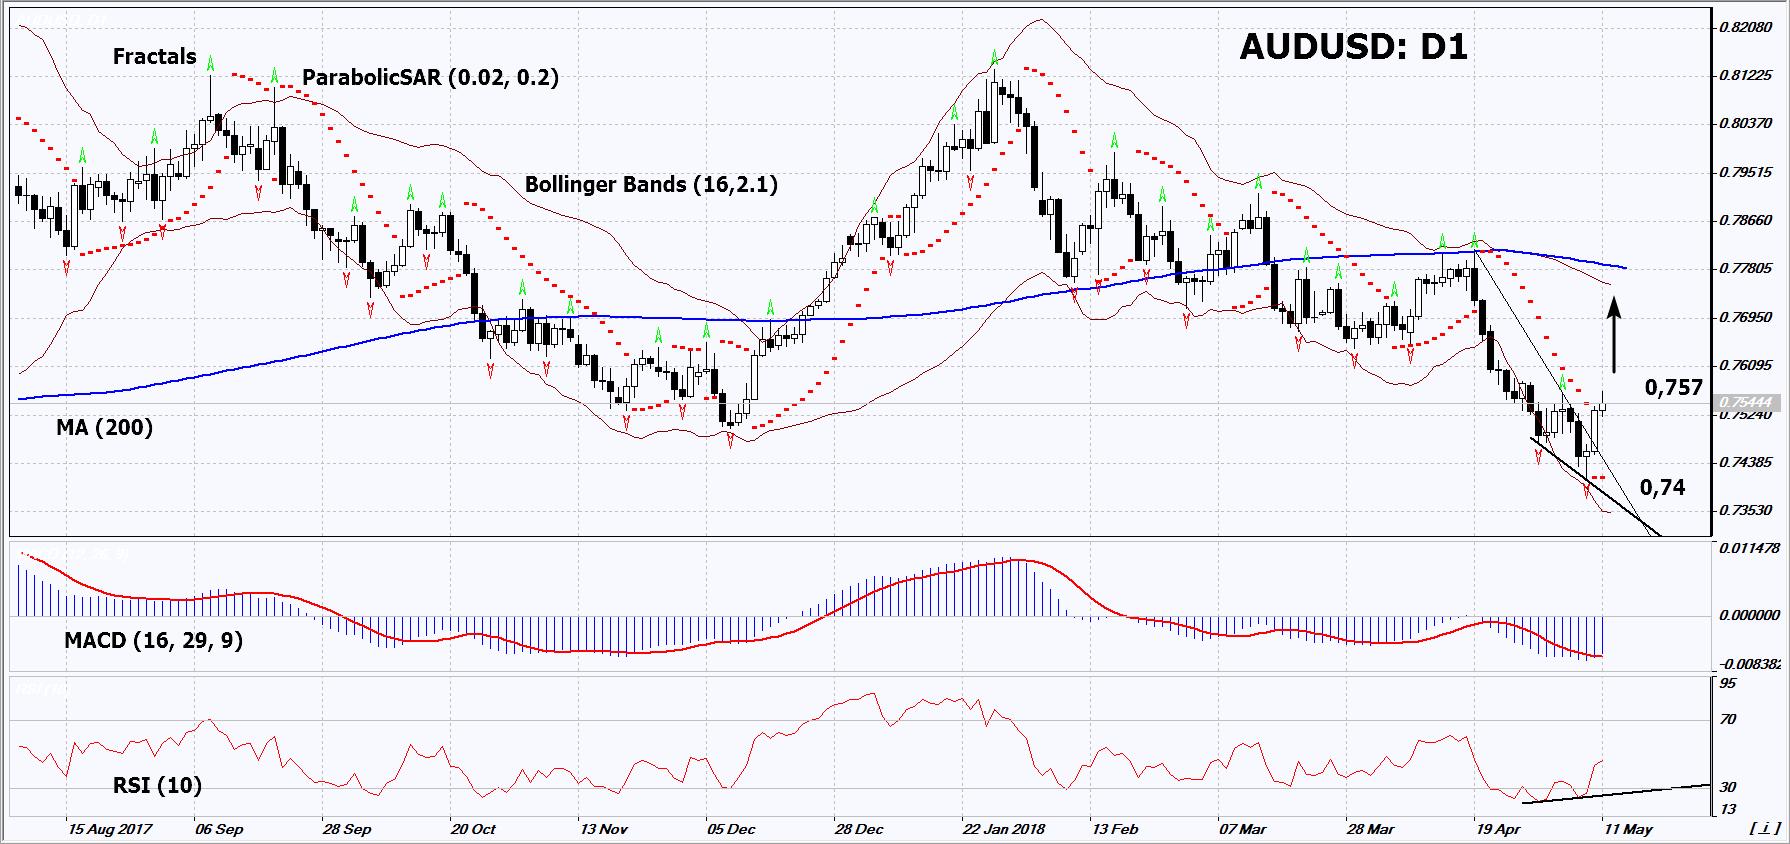
On the daily timeframe, AUDUSD: D1 has ended the short-term downtrend. The further prices increase is possible in case of the publication of positive economic data in Australia and negative - in the US..
- The Parabolic indicator gives bullish signals.
- The Bollinger bands have widened, which indicates high volatility.
- The RSI indicator is below 50. It has formed a positive divergence.
- The MACD indicator gives bullish signals.
The bullish momentum may develop in case AUDUSD exceeds the last fractal high at 0.757. This level may serve as an entry point. The initial stop loss may be placed below the last fractal low, the minimum for 11 months and the Parabolic signal at 0.74. After opening the pending order, we shall move the stop to the next fractal low following the Bollinger and Parabolic signals. Thus, we are changing the potential profit/loss to the breakeven point. More risk-averse traders may switch to the 4-hour chart after the trade and place there a stop loss moving it in the direction of the trade. If the price meets the stop level at 0.74 without reaching the order at 0.757, we recommend to close the position: the market sustains internal changes that were not taken into account.
Summary of technical analysis
| Position | Buy |
| Buy stop | Above 0,757 |
| Stop loss | Below 0,74 |
- Get Certificate

Note:
This overview has an informative and tutorial character and is published for free. All the data, included in the overview, are received from public sources, recognized as more or less reliable. Moreover, there is no guarantee that the indicated information is full and precise. Overviews are not updated. The whole information in each overview, including opinion, indicators, charts and anything else, is provided only for familiarization purposes and is not financial advice or а recommendation. The whole text and its any part, as well as the charts cannot be considered as an offer to make a deal with any asset. IFC Markets and its employees under any circumstances are not liable for any action taken by someone else during or after reading the overview.
