- Analytics
- Technical Analysis
Brent vs Ruble Technical Analysis - Brent vs Ruble Trading: 2015-12-30
Trading commodity currency
Brent crude oil price chart (ruble denominated) has severely deviated from its 200-day moving average line for the 6th time in 12 months. Previously it was in retrogressive movement. In the two last cases, end of October and mid-November, it has not yet reached its middle line but showed several days of strong growth. Not the chart has reversed to the upwards again. Will the prices continue its way up?
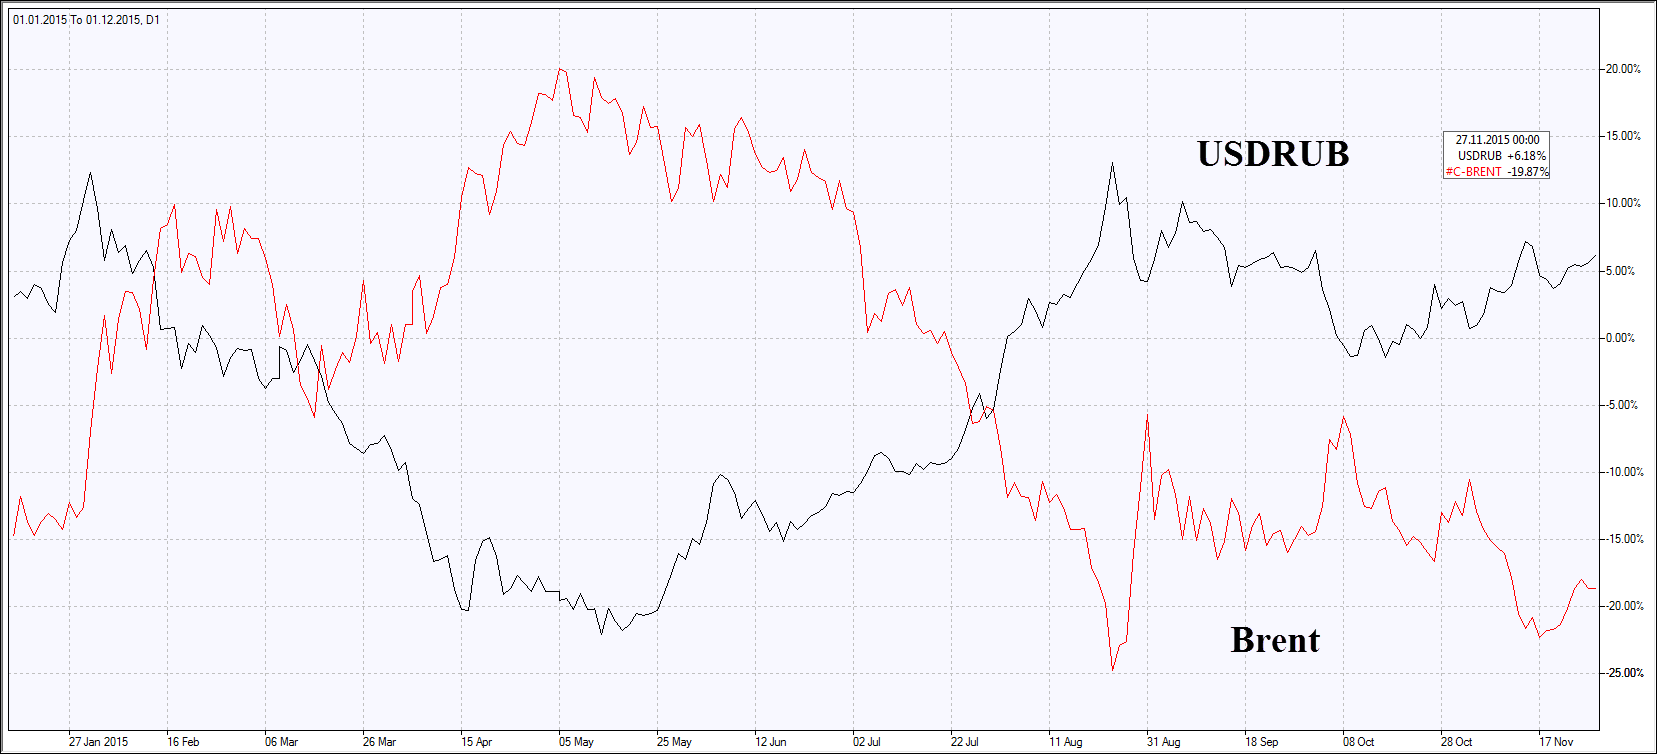
The ruble is dependent on oil prices as the share of fuel and energy products in the Russian exports is quite substantial. In January-October of 2015 it amounted to 64%. The falling oil prices make the ruble weaker against the US dollar and vice versa. As a result, the Brent prices in rubles are hovering around their average line. On the chart of the percentage change in ruble and oil prices we may see how they are negatively correlated. The Russian GDP slumped 4% in November and 3.8% in 11 months of 2015. In our opinion, this gives the background for the faster ruble weakening and it the positive for the instrument in question. Moreover, the growth may be supported by the higher oil prices amid the Saudi Arabia’s decision to cut the record budget deficit of $98bn. Currently the goal shall be fulfilled by the reduced spending but some market participants assume Saudi Arabia may take further steps to support the global oil prices growth.
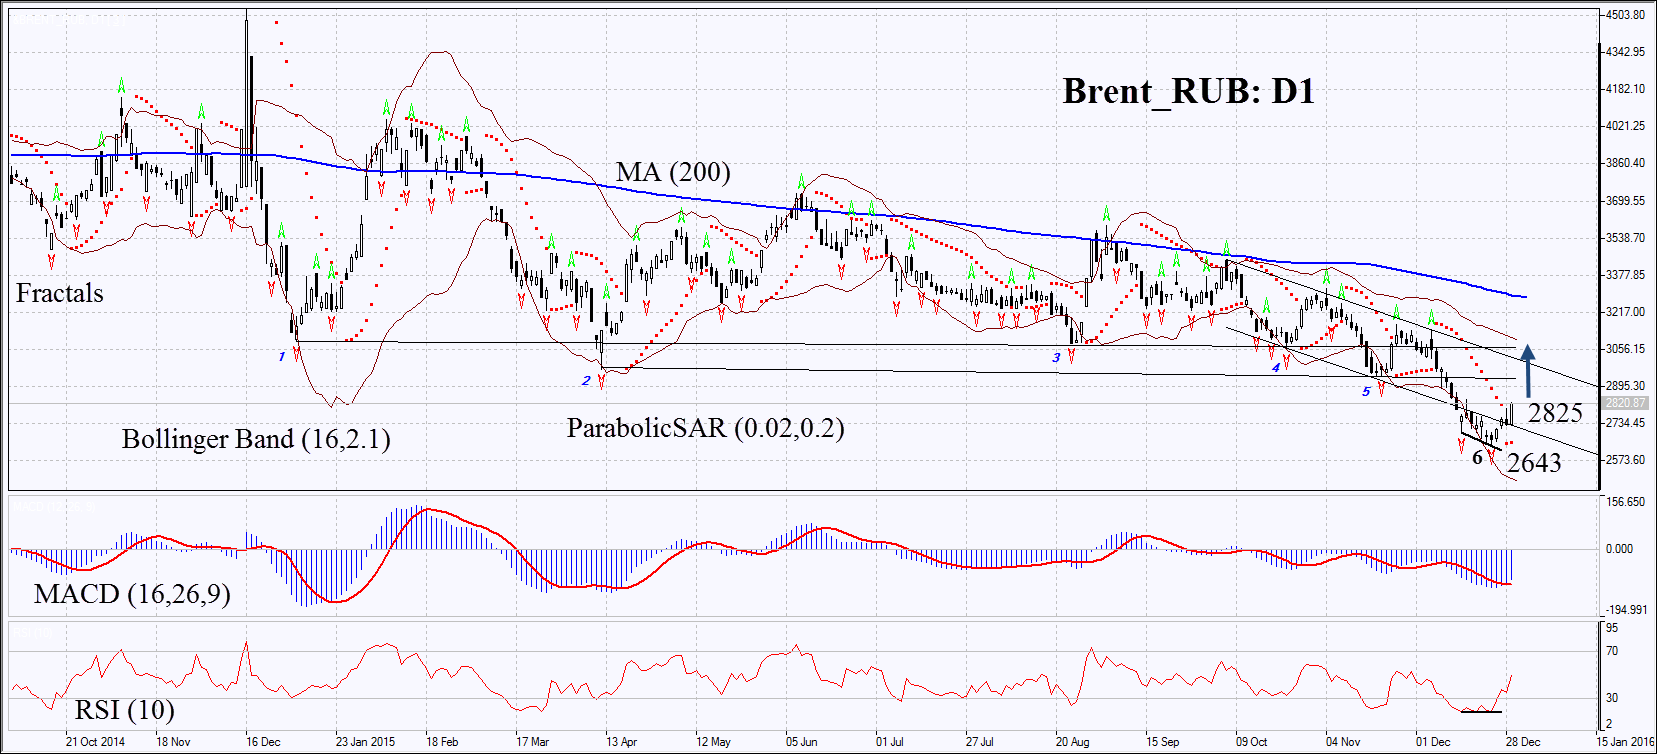
On the daily chart &Brent_RUB: D1 is within the downtrend for a month. Now it began to correct upwards. The Parabolic and MACD indicators have formed the buy signals. RSI is neutral and slightly below 50. It has formed the positive divergence. The Bollinger bands have widened a lot which may mean higher volatility. The bullish momentum may develop in case the personal composite instrument surpasses the upper Parabolic signal at 2825. This level may serve the point of entry. The initial risk-limit may be placed below the Parabolic signal and the last fractal low at 2643. Having opened the pending order we shall move the stop to the next fractal low following the Parabolic and Bollinger signals. Thus, we are changing the probable profit/loss ratio to the breakeven point. The most risk-averse traders may switch to the 4-hour chart after the trade and place there a stop-loss moving it in the direction of the trade. If the price meets the stop-loss level at 2643 without reaching the order at 2825, we recommend cancelling the position: the market sustains internal changes which were not taken into account.
| Position | Buy |
| Buy stop | above 2825 |
| Stop loss | below 2643 |
- Get Certificate

Note:
This overview has an informative and tutorial character and is published for free. All the data, included in the overview, are received from public sources, recognized as more or less reliable. Moreover, there is no guarantee that the indicated information is full and precise. Overviews are not updated. The whole information in each overview, including opinion, indicators, charts and anything else, is provided only for familiarization purposes and is not financial advice or а recommendation. The whole text and its any part, as well as the charts cannot be considered as an offer to make a deal with any asset. IFC Markets and its employees under any circumstances are not liable for any action taken by someone else during or after reading the overview.
