- Analytics
- Technical Analysis
EU 50 Index Technical Analysis - EU 50 Index Trading: 2017-11-03
Improving economic data bullish for EU50
Improving euro-zone economic performance is bullish for European stocks. Will the EU50 stock index continue the rise?
Recent better than expected data indicate euro-zone economic performance is improving. Eurostat reported on Tuesday euro-zone Q3 GDP grew 2.5% over year instead of expected 2.4% and unemployment fell from 9% to 8.9%, lowest in almost nine years. Improving euro-zone economic performance is bullish for EU50 stock index.
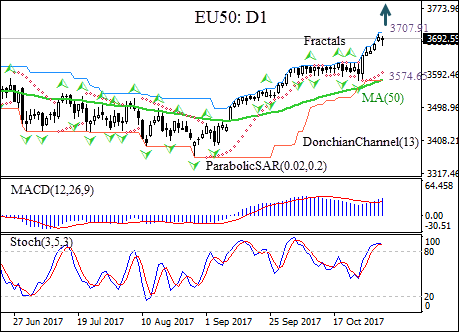
On the daily timeframe EU50: D1 is retracing after it hit 27-month high two sessions ago.
- The Donchian channel indicates no uptrend yet: it is flat.
- The MACD indicator is above the signal line and the gap is widening, which is a bullish signal.
- The Parabolic indicator gives a buy signal.
- The stochastic oscillator has breached into the overbought zone, this is a bearish signal.
We believe the bullish momentum will continue as the price breaches above the upper Donchian boundary at 3707.91. A price point above that level can be used as an entry point for a pending order to buy. The stop loss can be placed below the last fractal low at 3574.65. After placing the pending order the stop loss is to be moved every day to the next fractal low, following Parabolic signals. Thus, we are changing the probable profit/loss ratio to the breakeven point. If the price meets the stop-loss level (3574.65) without reaching the order we recommend cancelling the position: the market sustains internal changes which were not taken into account.
Technical Analysis Summary
| Position | Buy |
| Buy stop | Above 3707.91 |
| Stop loss | Below 3574.65 |
- Get Certificate

Note:
This overview has an informative and tutorial character and is published for free. All the data, included in the overview, are received from public sources, recognized as more or less reliable. Moreover, there is no guarantee that the indicated information is full and precise. Overviews are not updated. The whole information in each overview, including opinion, indicators, charts and anything else, is provided only for familiarization purposes and is not financial advice or а recommendation. The whole text and its any part, as well as the charts cannot be considered as an offer to make a deal with any asset. IFC Markets and its employees under any circumstances are not liable for any action taken by someone else during or after reading the overview.
