- Analytics
- Technical Analysis
EUR/USD Technical Analysis - EUR/USD Trading: 2016-03-10
The ECB meeting will be held on Thursday, 10th of March
The meeting of the European Central Bank will be held on Thursday, 10th of March at 13-45 CET. The final press conference of its president Mario Draghi will take place at 14-30 CET. According to most forecasts the ECB will lower the deposit rate by another 10 basis points - to minus 0.4%. At the same time the refinancing rate and the marginal lending rate will remain at current levels of 0.05% and 0.3%, respectively. Also some investors expect a monthly increase in the volume of securities repurchase due to the euro issue increase: from the current 60 billion to 70 billion. Shall the decision of the ECB weaken the euro?
We also shall note that data on foreign trade in Germany in January will be released at 8:00 CET on 10th of March. It may affect the dynamics of the euro but to a much lesser extent than the ECB decision. Nevertheless, in our opinion, the surplus forecast is likely to be negative for the euro. It is the first time since April 2015 when the surplus is expected to be less than 20 billion euro. We suppose that possible lowering of deposit rate and issue expanding may weaken the exchange rate of the European currency. For the first time, the ECB has set a negative rate on deposits in the middle of June in 2014. After that, the exchange rate has fallen from 1.37 US dollars per euro to the lowest level since 2003 – 1,046 US dollars per euro. It should be noted that the deposit rate was moving to the negative area three times, each time by 0.1%, or 10 basis points. Its current level (-0.3%) is valid since December 2015. The main argument in favor of the ECB's easing monetary policy is a risk of deflation. Inflation in the Euro zone was negative and amounted to -0.2% in February. At the same time the aim of the ECB is a rise in consumer prices close to 2% in annual terms. German commercial banks actively oppose further reduction of deposit rates since it implies difficulty to their work.
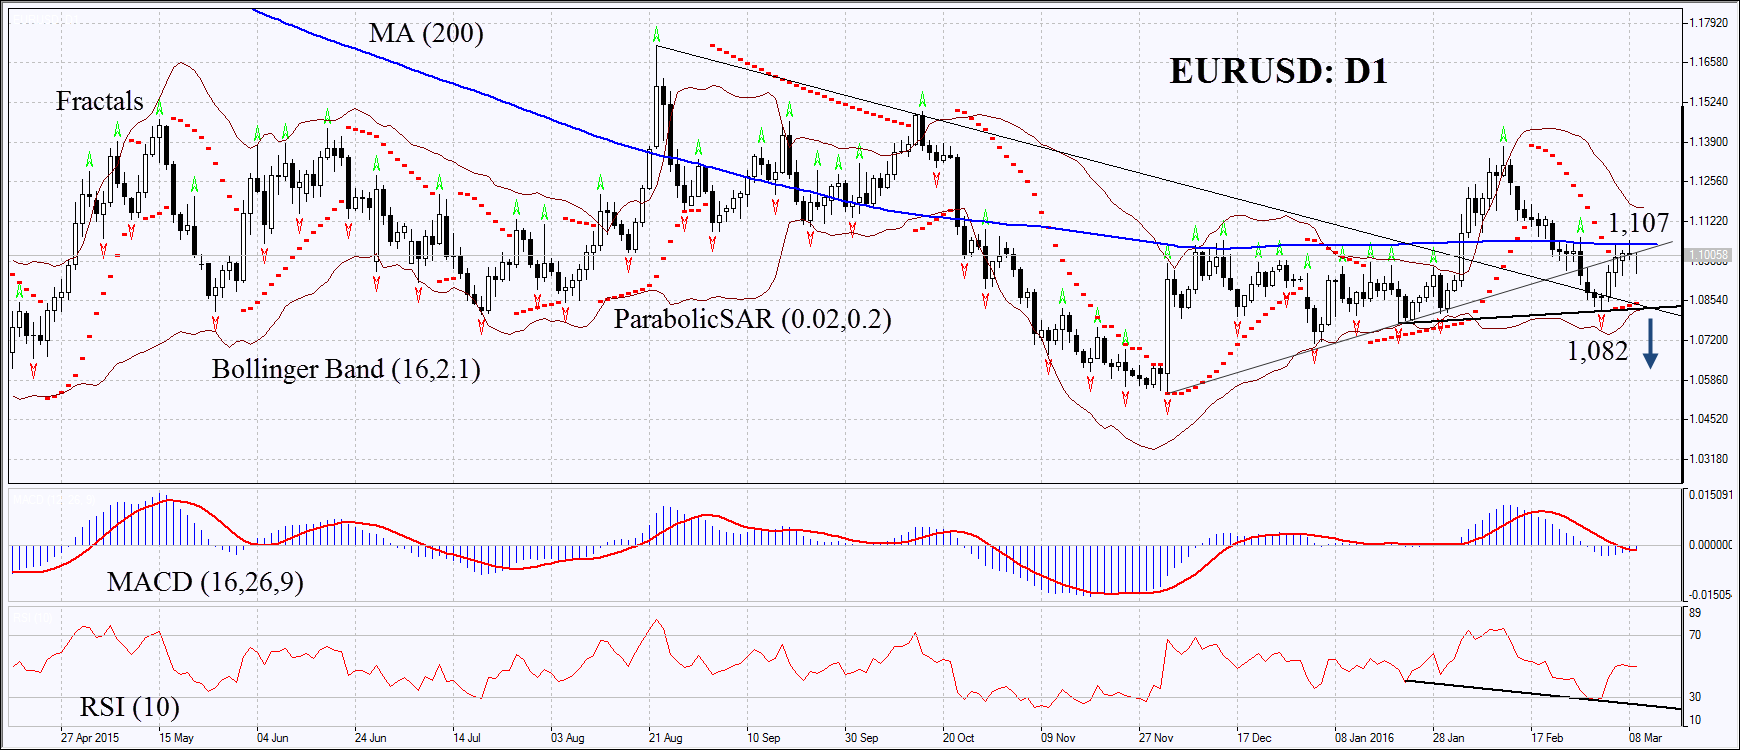
On the daily timeframe EURUSD: D1 increases within multi-month neutral trend. Parabolic indicator and MACD formed a signal to buy. The RSI exceeded 50, but formed a divergence for sale. Bollinger bands are narrowed which means low volatility. Euro is trading around its 200-day moving average line but can not overcome it during the last few days. We do not exclude the bearish movement if the euro falls below the last lower fractal, the Parabolic and Bollinger indicators, as well as below the trend line support: 1,082. This level can be used as an entry point. Initial risk limit could be set above the last upper fractal, 200-day moving average line, as well as the trend line: 1,107. After the opening of a pending order we should move the stop after Bollinger and Parabolic to the next fractal high. Thus, we are changing the potential ratio of profit/loss in our favor. Most cautious traders can change to a four-hour time frame and set the stop-loss following the direction of a price after making the deal. If the price overcomes the stop level (1,107) without activating the order (1,082) the position is recommended to be removed: the market internal changes occur that were taken into account.
| Position | Sell |
| Sell stop | below 1,082 |
| Stop loss | above 1,107 |
Explore our
Trading Conditions
- Spreads from 0.0 pip
- 30,000+ Trading Instruments
- Stop Out Level - Only 10%
Ready to Trade?
Open Account Note:
This overview has an informative and tutorial character and is published for free. All the data, included in the overview, are received from public sources, recognized as more or less reliable. Moreover, there is no guarantee that the indicated information is full and precise. Overviews are not updated. The whole information in each overview, including opinion, indicators, charts and anything else, is provided only for familiarization purposes and is not financial advice or а recommendation. The whole text and its any part, as well as the charts cannot be considered as an offer to make a deal with any asset. IFC Markets and its employees under any circumstances are not liable for any action taken by someone else during or after reading the overview.
