- Analytics
- Technical Analysis
EUR/USD Technical Analysis - EUR/USD Trading: 2016-06-06
Labour market data reduced chances for Fed rate hike
Disappointing labour market data for May came out in US on Friday. The nonfarm payrolls fell to the lowest since September 2010 to 38 thousand, far below the anticipated 160 thousand. As a result, the US dollar tumbled as market participants became skeptical about the looming Fed rate hike. On the other hand, the euro surged. Will its increase go on?
The US unemployment fell to the lowest since November 2007 but the news failed to support investors’ confidence as some Americans quit searching jobs and stopped being unemployed. The Fed funds futures price in only 4% chance for the rate hike on June 15, the data showed on Friday, down from 21% on Thursday. The chances for July rate hike fell to 38% from 60%. The European economic indicators look stronger than the US ones. European GDP rose in Q1 2016 to 1.5% year on year which is far above the 0.8% US GDP increase in the same period. The ECB met on Thursday where the policymakers revised up the GDP outlook for 2016 from 1.4% to 1.6%. The inflation outlook was slightly improved from 0.1% to 0.2% which is far below the target ECB level of 2%. Such a slight increase in consumer prices will let the European policymakers to go on with expansionary monetary policy to stimulate the national economy. It currently purchases bonds as part of TLTRO program for a total amount of 1.74trn euros. In theory, this may resolve problems with debts of Greece and other countries as well as minimize the deflation risks.
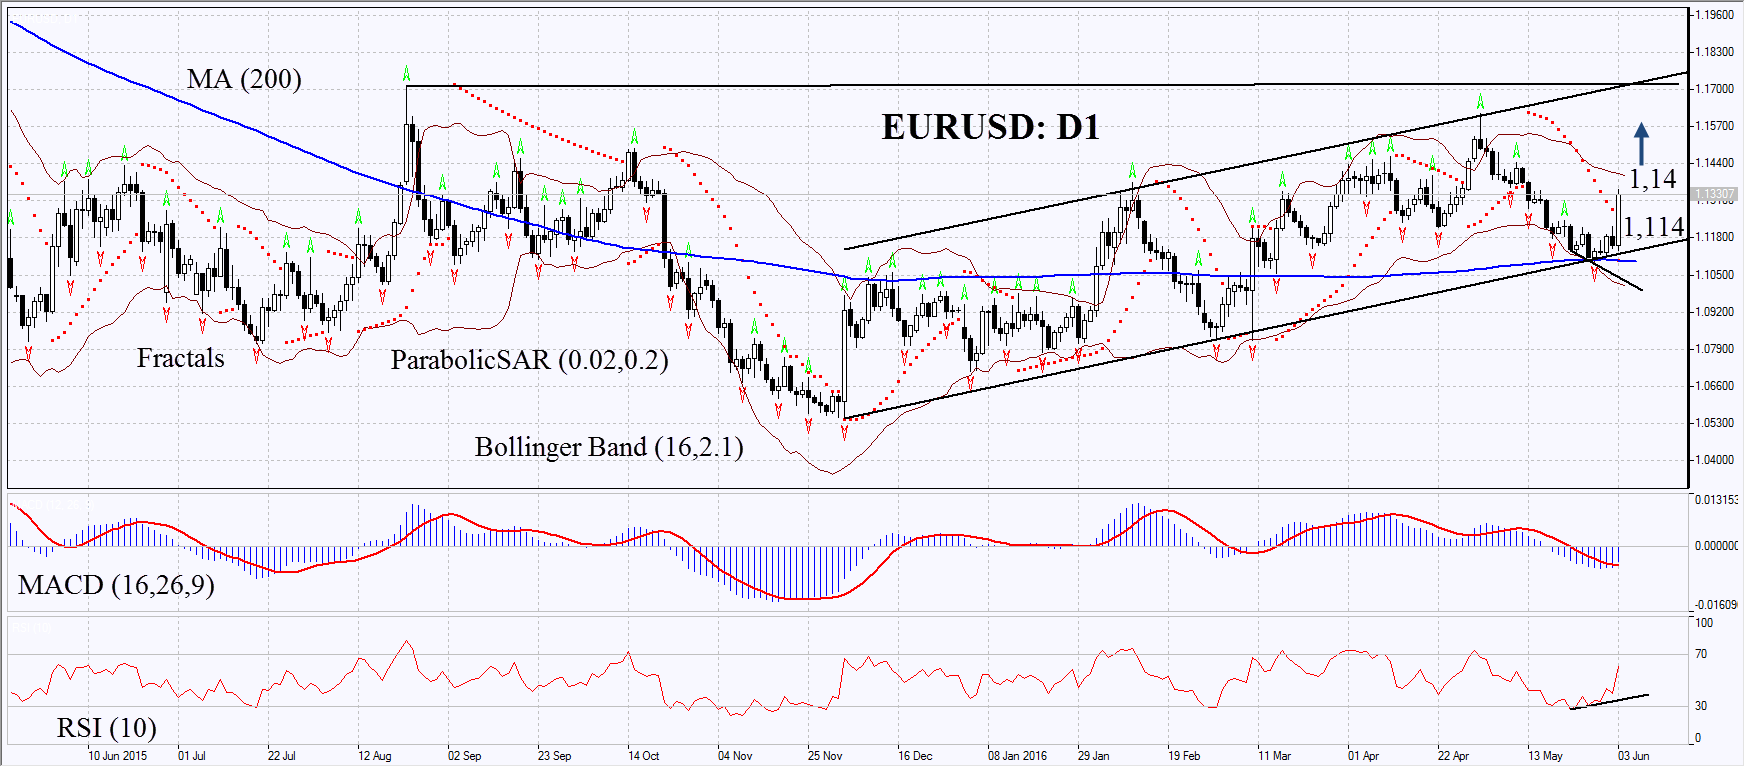
On the daily chart EURUSD: D1 has started growing having rebounded from support of the uptrend and its 200-day moving average. The MACD and Parabolic indicators give signals to buy. The RSI has reached the level of 50 but has not yet entered the overbought zone. Previously it has formed slight positive divergence. The Bollinger bands have narrowed which means moderate volatility. The bullish momentum may develop in case the euro surpasses the upper Bollinger band at 1.14. This level may serve the point of entry. The initial risk limit may be placed below the Friday low at 1.114. Having opened the pending order we shall move the stop to the next fractal low following the Parabolic and Bollinger signals. Thus, we are changing the probable profit/loss ratio to the breakeven point. The most risk-averse traders may switch to the 4-hour chart after the trade and place there a stop-loss moving it in the direction of the trade. If the price meets the stop-loss level at 1.114 without reaching the order at 1.14, we recommend cancelling the position: the market sustains internal changes which were not taken into account.
| Position | Buy |
| Buy stop | above 1.14 |
| Stop loss | below 1.114 |
- Get Certificate

Note:
This overview has an informative and tutorial character and is published for free. All the data, included in the overview, are received from public sources, recognized as more or less reliable. Moreover, there is no guarantee that the indicated information is full and precise. Overviews are not updated. The whole information in each overview, including opinion, indicators, charts and anything else, is provided only for familiarization purposes and is not financial advice or а recommendation. The whole text and its any part, as well as the charts cannot be considered as an offer to make a deal with any asset. IFC Markets and its employees under any circumstances are not liable for any action taken by someone else during or after reading the overview.
