- Analytics
- Technical Analysis
GB 100 Index Technical Analysis - GB 100 Index Trading: 2019-01-24
Slowing retail sales bearish for GB100
UK’s retail trade growth slowed in December. Will the GB100 continue declining?
Recent UK economic data were negative: retail sales growth in the UK eased to 3% over year in December 2018. The expectations were retail sales would remain steady at 3.6%, while the reading for November was revised downwardly to 3.4%. It is not surprising consumers have reined in spending when lawmakers can’t agree on Brexit plan as Prime Minister Theresa May started cross-party discussions to arrive at an acceptable compromise to the Brexit deal which was rejected by Parliament. The economic and political uncertainty of the terms of UK’s departure from the European Union is still an unresolved downside risk for UK economy. Weak economic data are bearish for GB100.
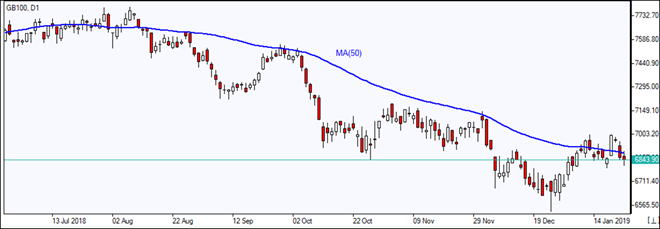
On the daily timeframe the GB100: D1 is falling after retracing to two-month high in the beginning of December.
- The Parabolic indicator gives a buy signal.
- The Donchian channel indicates no trend yet: it is flat.
- The MACD indicator gives a bearish signal: it is above the signal line and the gap is narrowing.
- The RSI oscillator is falling but has not breached into oversold zone yet.
We believe the bearish momentum will continue after the price breaches below lower boundary of Donchian channel at 6797.48. This level can be used as an entry point for placing a pending order to sell. The stop loss can be placed above the last fractal high at 7002.02. After placing the order, the stop loss is to be moved every day to the next fractal high, following Parabolic signals. Thus, we are changing the expected profit/loss ratio to the breakeven point. If the price meets the stop loss level (7002.02) without reaching the order (6797.48), we recommend cancelling the order: the market has undergone internal changes which were not taken into account.
Technical Analysis Summary
| Position | Sell |
| Sell stop | Below 6797.48 |
| Stop loss | Above 7002.02 |
- Get Certificate

Note:
This overview has an informative and tutorial character and is published for free. All the data, included in the overview, are received from public sources, recognized as more or less reliable. Moreover, there is no guarantee that the indicated information is full and precise. Overviews are not updated. The whole information in each overview, including opinion, indicators, charts and anything else, is provided only for familiarization purposes and is not financial advice or а recommendation. The whole text and its any part, as well as the charts cannot be considered as an offer to make a deal with any asset. IFC Markets and its employees under any circumstances are not liable for any action taken by someone else during or after reading the overview.
