- Analytics
- Technical Analysis
Nikkei Index Technical Analysis - Nikkei Index Trading: 2015-10-12
Japanese index pushed up by oil price
The Japanese currency continues losing its positions. Markets expect the Bank of Japan to revise down the key rate in October. The move shall stimulate the business lending amid the slowing Japanese GDP growth of 1% a year and to weaken the currency against the dollar. By the way, the US dollar index live data indicate US dollar weakened 0.5% against six major currencies during the one week period. Another factor is the Brent crude oil price going up by 12% last week which is the weekly record since 2009. As the oil price has a huge influence on the inflationary expectations, the major indices are growing over a week. Nikkei is not an exception given the weaker Yen and the looser monetary policy by the Bank of Japan. Will the index manage to secure its growth and comfort investors?
At this moment we are seeing the end of the bearish trend on the Nikkei daily chart. The price is consolidated near the weekly support and is ready to break the channel. The Parabolic trend indicator has shown the bullish reversal near the support. The oscillator RSI-Bars dynamics compels attention having formed the uptrend channel. We assume the breakout of the 18490.4 price level will provoke the volatility momentum and the sharp index growth. This signal is likely to be accompanied by leaving the channel, the upper line of which is confirmed by the Donchian channel. It is worthy of note that the resistance of 18490.4 was twice confirmed by the Bill Williams fractals. The support of 16893.5 rests, in its turn, upon the weekly support and is confirmed by two trend indicators. This means the level may be used to limit risks.
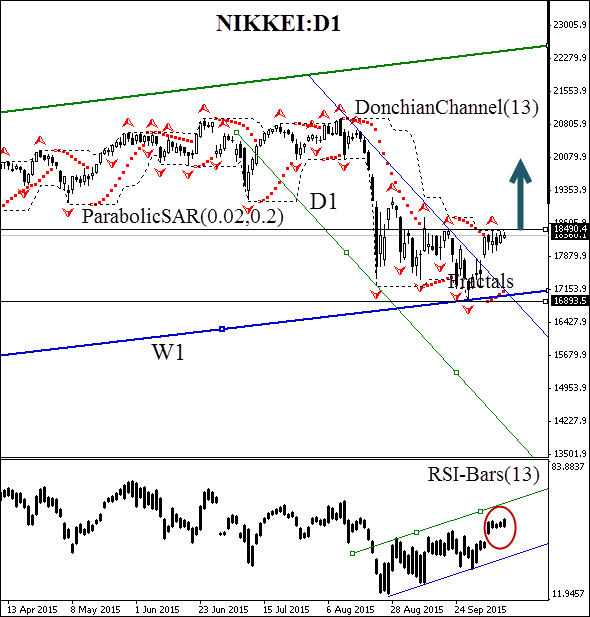
We suggest opening the pending order to buy after the breakout of the resistance at 18490.4. The aggressive traders may place a delayed order at this level which is confirmed by the Donchian channel. The risk limits shall be fixed at the previous Bill Williams fractal low at 18490.4 (the lower channel line). The stop shall be moved to the next low following the Parabolic signal. Thus, we are changing the probable profit/loss ratio to the breakeven point. Despite the high probability of this scenario the index may lose its rising momentum. First of all, the risks are inherent in the US Fed rate hike. The move may lower the inflationary expectations and strengthen the Japanese currency. Nevertheless, we consider the Nikkei channel breakout to be possible only in case of the long term fundamental trend.
| Position | Buy |
| Buy stop | above 18490.4 |
| Stop loss | below 16893.5 |
- Get Certificate

Note:
This overview has an informative and tutorial character and is published for free. All the data, included in the overview, are received from public sources, recognized as more or less reliable. Moreover, there is no guarantee that the indicated information is full and precise. Overviews are not updated. The whole information in each overview, including opinion, indicators, charts and anything else, is provided only for familiarization purposes and is not financial advice or а recommendation. The whole text and its any part, as well as the charts cannot be considered as an offer to make a deal with any asset. IFC Markets and its employees under any circumstances are not liable for any action taken by someone else during or after reading the overview.
