- Analytics
- Technical Analysis
S&P 500 Technical Analysis - S&P 500 Trading: 2018-11-23
Slower industrial growth bearish for SP500
US housing and industrial sectors growth slowed more than expected in October. Will the SP500 continue declining?
US economic data were negative on balance lately. After a stronger than expected October jobs report and retail sales data updates from housing and industrial sectors were weaker than expected: industrial production growth slowed to 0.1% over month in October instead of steady growth at 0.2%, and housing starts rose slower than forecast while building permits continued falling in October albeit at a slightly lower rate than in previous month. And business investment was weak for the third month in a row: capital goods orders, (nondefense excluding aircrafts) were stagnant in October as durable goods (made to last at least three years) orders fell 4.4%, the biggest decline in 15 months. Weaker data are bearish for SP500.
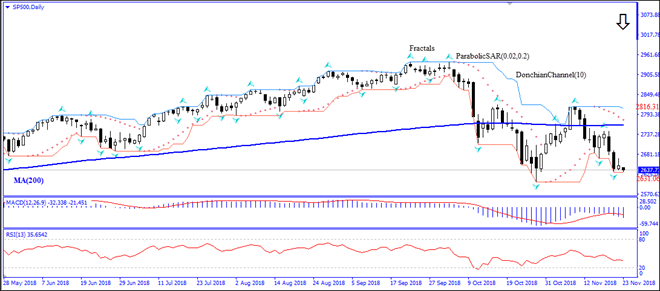
On the daily timeframe the SP500 is below the 200-day moving average MA(200) which has leveled off, this is bearish.
- The Parabolic indicator gives a sell signal.
- The Donchian channel indicates downtrend: it is tilting lower.
- The MACD indicator gives a bearish signal: it is below the signal line and the gap is widening.
- The RSI indicator is falling but has not breached into oversold the zone.
We believe the bearish momentum will continue after the price breaches below the lower boundary of Donchian channel at 2631.06. This level can be used as an entry point for placing a pending order to sell. The stop loss can be placed above the upper Donchian channel at 2816.31. After placing the order, the stop loss is to be moved every day to the next fractal high, following Parabolic signals. Thus, we are changing the probable profit/loss ratio to the breakeven point. If the price meets the stop loss level (2816.31) without reaching the order (2631.06), we recommend cancelling the order: the market has undergone internal changes which were not taken into account.
Technical Analysis Summary
| Position | Sell |
| Sell stop | Below 2631.06 |
| Stop loss | Above 2816.31 |
- Get Certificate

Note:
This overview has an informative and tutorial character and is published for free. All the data, included in the overview, are received from public sources, recognized as more or less reliable. Moreover, there is no guarantee that the indicated information is full and precise. Overviews are not updated. The whole information in each overview, including opinion, indicators, charts and anything else, is provided only for familiarization purposes and is not financial advice or а recommendation. The whole text and its any part, as well as the charts cannot be considered as an offer to make a deal with any asset. IFC Markets and its employees under any circumstances are not liable for any action taken by someone else during or after reading the overview.
