- Analiz
- Teknik analiz
USD/SGD Teknik Analiz - USD/SGD Ticaret: 2021-06-22
USD/SGD Teknik Analiz Özeti
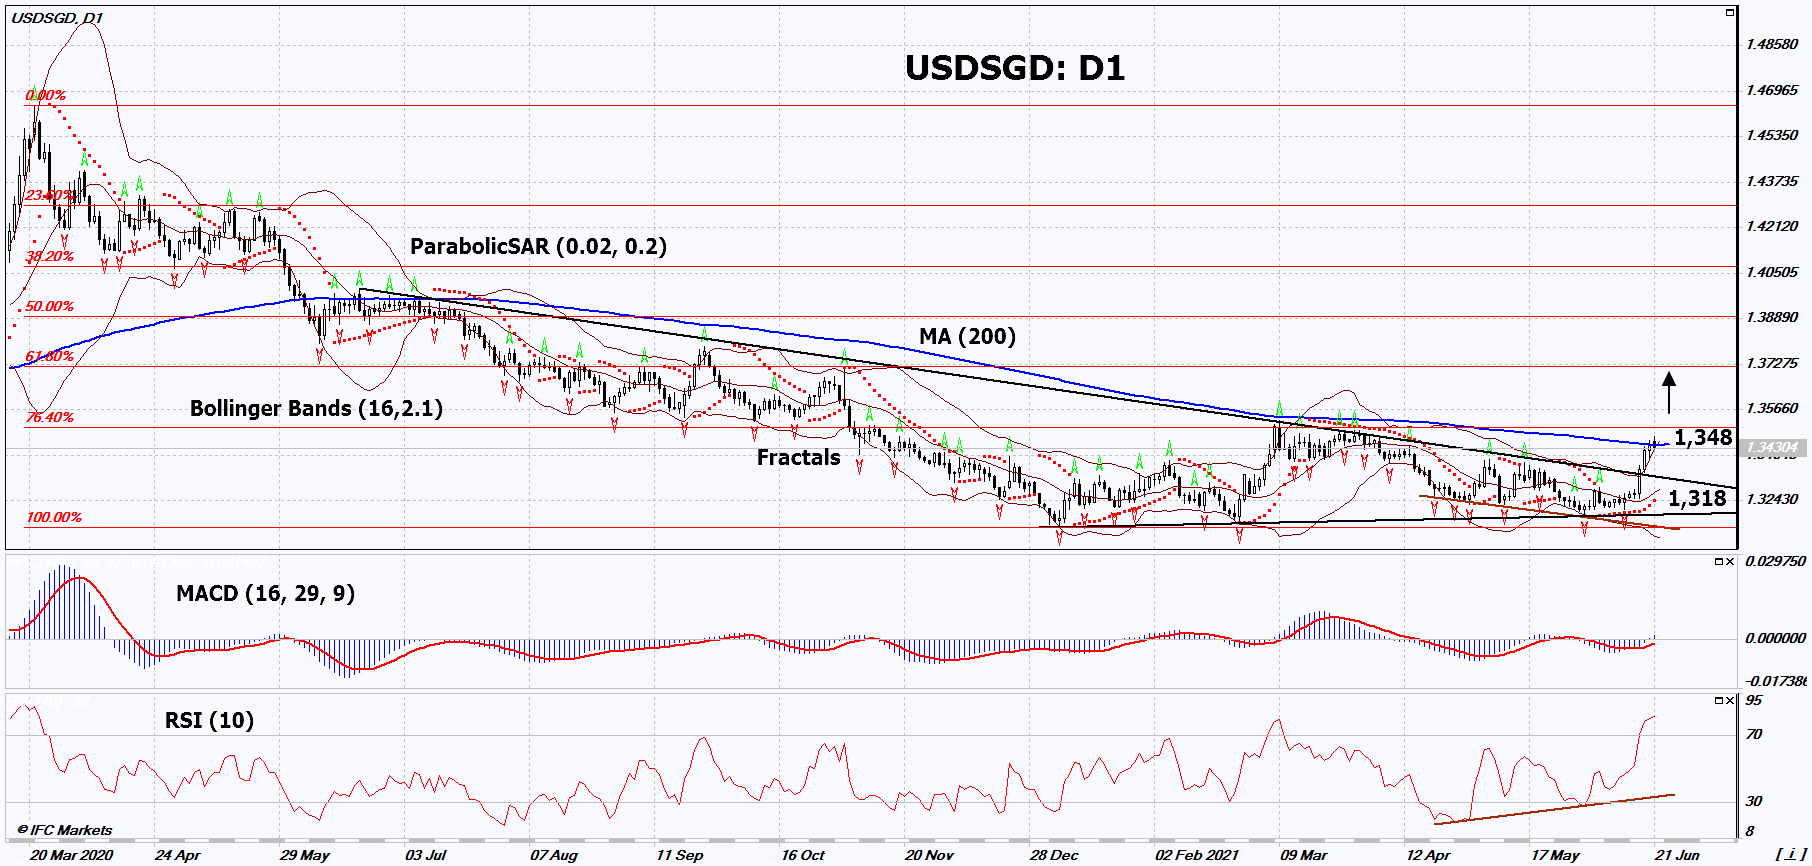
Above 1.348
Buy Stop
Below 1.318
Stop Loss
| Gösterge | Sinyal |
| RSI | Nötr |
| MACD | AL |
| MA(200) | Nötr |
| Fractals | AL |
| Parabolic SAR | AL |
| Bollinger Bands | Nötr |
USD/SGD Grafik analizi
USD/SGD Teknik analiz
On the daily timeframe, USDSGD: D1 came out of the triangle and downtrend. A number of technical analysis indicators have generated signals for further growth. We are not ruling out a bullish movement if USDSGD rises above its most recent high, the Upper Bollinger Band and the 200-day Moving Average Line: 1.348. This level can be used as an entry point. The initial risk limitation is possible below the Parabolic signal and 2 last lower fractals: 1.318. After opening a pending order, move the stop to the next fractal low following the Bollinger and Parabolic signals. Thus, we change the potential profit/loss ratio in our favor. The most cautious traders, after making a deal, can go to the four-hour chart and set a stop-loss, moving it in the direction of movement. If the price overcomes the stop level (1.318) without activating the order (1.348), it is recommended to delete the order: there are internal changes in the market that were not taken into account.
Temel analiz Pariteler - USD/SGD
Inflation may rise in Singapore. Will the growth of the USDSGD quotes continue?
An upward movement signifies a weakening of the Singapore dollar against the US dollar. Singapore inflation for May will be published on June 23rd. According to forecasts, it may turn out to be the same as in April and amount to 2.1% in annual terms. This is the maximum since May 2014. The current inflation rate is well above the Monetary Authority of Singapore's rate of 0.06%. On June 25, Singapore will release industrial production for May. It is expected to decrease compared to April. Earlier, Singapore's Non-Oil Exports data for May was released, which turned out to be worse than expected. In turn, the Fed's plans to tighten monetary policy are a positive factor for the US dollar.
Explore our
Trading Conditions
- Spreads from 0.0 pip
- 30,000+ Trading Instruments
- Stop out seviyesi %10
Ready to Trade?
Open Account Not:
Bu bilgilendirici ve eğitici bir genel bakıştır ve ücretsiz olarak yayımlanmaktadır. Burada yer alan tüm veriler kamu kaynaklarından alınmış ve az çok güvenilir olarak kabul edilmiştir. Aynı zamanda, bilgilerin tam ve doğru olduğuna dair hiçbir garanti yoktur. Gelecekte bunlar güncellenmemektedirler. Görüşler, göstergeler, grafikler ve kalan her şey dahil olmak üzere her genel bakışta olan tüm bilgiler sadece değerlendirme amacıyla sağlanıp mali dalışmanlık veya tavsiye niteliğinde değildirler. Tüm metin ve onun herhangi bir bölümünü veya grafikleri herhangi bir varlıkla işlem yapmak için bir teklif olarak kabul edilemez. IFC Markets şirketi ve şirket çalışanları bu genel bakışın incelenmesi sırasında veya sonrasında başkası tarafından alınan herhangi bir eylem için hiçbir koşulda sorumlu değildir.

