- Analiz
- Teknik analiz
Altın/Gümüş Teknik Analiz - Altın/Gümüş Ticaret: 2019-07-17
Silver rises in price against gold
The gold to silver ratio is adjusted down from the historical maximum. Will the decline of XAUXAG quotations continue?
Such dynamics is observed when gold becomes cheaper, and silver becomes more expensive. The cost of gold fell against the strengthening of the dollar after the publication of good macroeconomic indicators in the United States. Growth in retail sales in June exceeded forecasts and amounted to + 0.4% compared with June. Year to year, retail sales grew by 3.4%. Positive US statistics may limit the potential rate cut by the Fed. Silver quotations, on the contrary, soared yesterday a 4-month high. Some very important reasons for this growth have not been voiced. However, it can be noted that for 10 years the world balance of silver has a stable annual deficit, covered by global reserves. So, in 2018, the global deficit was 80 million ounces. In addition, investors have noted an increase in demand for investment coins and silver bars against the background of sharply rising gold.
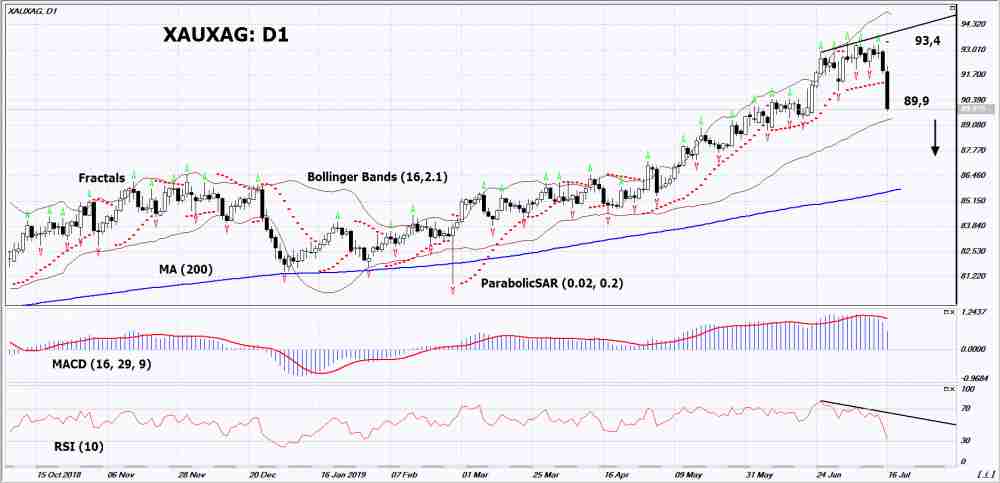
On the daily timeframe XAUXAG: D1 adjusted from the historical maximum. Various technical analysis indicators formed bearish signal. Decrease in quotations is possible if high demand for silver remains.
- The Parabolic indicator indicates signal to decrease.
- The Bolinger bands expanded, indicating a volatility decrease. The top line slopes down.
- The RSI indicator is below 50. It has formed a divergence to decrease.
- The MACD indicator gives bearish signal.
The bearish momentum may develop if XAUXAG drops below its last low: 89.9. This level can be used as an entry point. The initial stop lose may be placed above the last three upper fractals, the historical maximum and the Parabolic signal: 93.4. After opening the pending order, stop shall be moved following the the Bollinger and Parabolic signals to the next fractal minimum. Thus, we are changing the potential profit/loss to the breakeven point. More risk-averse traders may switch to the 4-hour chart after the trade and place a stop loss moving it in the direction of the trade. If the price meets the stop level (93,4) without reaching the order (89,9), we recommend to cancel the order: the market sustains internal changes that were not taken into account.
Technical Analysis Summary
| Position | Sell |
| Sell stop | Below 89,9 |
| Stop loss | Above 93,4 |
- Sertifika Al

Not:
Bu bilgilendirici ve eğitici bir genel bakıştır ve ücretsiz olarak yayımlanmaktadır. Burada yer alan tüm veriler kamu kaynaklarından alınmış ve az çok güvenilir olarak kabul edilmiştir. Aynı zamanda, bilgilerin tam ve doğru olduğuna dair hiçbir garanti yoktur. Gelecekte bunlar güncellenmemektedirler. Görüşler, göstergeler, grafikler ve kalan her şey dahil olmak üzere her genel bakışta olan tüm bilgiler sadece değerlendirme amacıyla sağlanıp mali dalışmanlık veya tavsiye niteliğinde değildirler. Tüm metin ve onun herhangi bir bölümünü veya grafikleri herhangi bir varlıkla işlem yapmak için bir teklif olarak kabul edilemez. IFC Markets şirketi ve şirket çalışanları bu genel bakışın incelenmesi sırasında veya sonrasında başkası tarafından alınan herhangi bir eylem için hiçbir koşulda sorumlu değildir.
